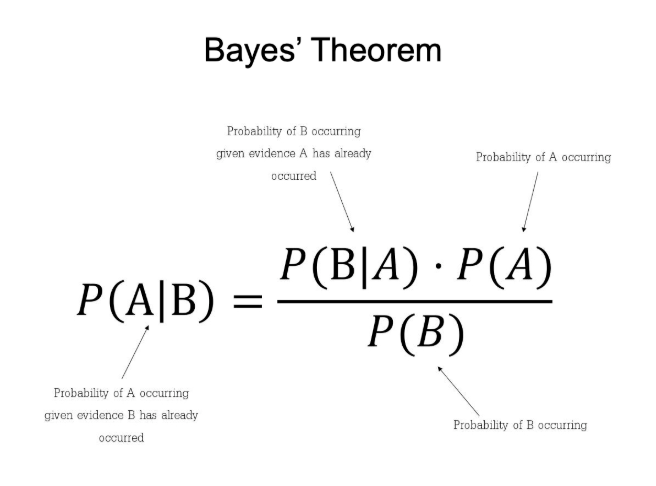
Bayes' Theorem is a fundamental concept in data science.
But it took me 2 years to understand its importance.
In 2 minutes, I'll share my best findings over the last 2 years exploring Bayesian Statistics. Let's go.
I sat down with my former corporate boss the morning after he officially resigned.
No longer bound by executive confidentiality, he confessed the darkest reality of upper management.
Enterprises actively use a silent psychological framework called Talent Captivity to intentionally sabotage your external resume.
Five engineered traps designed to kill your exit strategy.
Stop renting a chatbot and calling it your company’s brain.
Utopia is the first open-source enterprise world model I’ve seen that actually treats knowledge like a system, not a vibe.
It's a Self-hosted, open source and built around the one question every other knowledge base ignores: when.
Every fact in it carries a start date and an end date. Nothing gets overwritten. When something changes, the correction closes the old version and opens a new one. The history stays intact.
So the graph isn't a snapshot anymore. It's a recording you can rewind.
You drag a timeline on the screen and watch the whole thing redraw itself to show what was true on that date. Who owned what. What the policy said before it changed. All of it, replayable.
And every fact points back to the exact sentence it came from. Nothing gets in without a receipt.
Here's the part that got me.
The whole thing is one binary and one Postgres database. That's it. No Elasticsearch, no separate vector service and no message queue. Most RAG stacks are six services duct-taped together. This is two. It even runs fully offline on an air-gapped network with any model you want.
https://t.co/YIRsEAK9OD
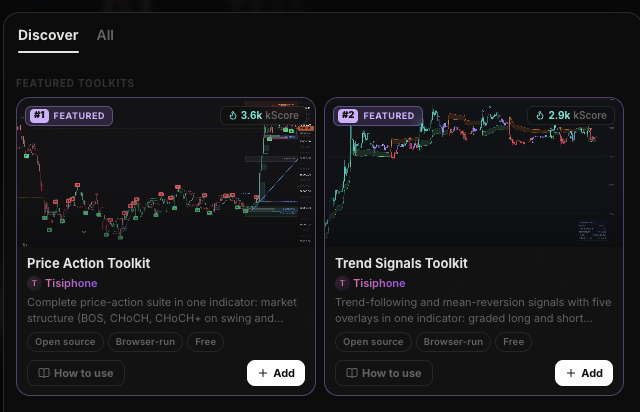
3 favorite indicator suites on TradingView which used to cost $1,000+/year are now 100% free to use and open source on OpenMarket thanks to our chad community member Tisiphone.
Use them as-is or fork it according to how you trade.
Price Action Toolkit
Maps the chart like an SMC trader doing manual markups: market structure breaks, fresh order blocks, fair value gaps, and liquidity sweeps.
Trend Signals Toolkit
Full execution plan in one script: entry signals, dynamic trailing stops, profit targets, and a trend-vs-chop filter so you stop longing the top of a range.
Oscillator Toolkit
Clean confirmation: money flow volume bands, divergence lines plotted straight on your price candles, and a confluence score for high-conviction entries.
Massive shoutout to Tisiphone.
Here's how to wire custom Hermes agents into the TradingView MCP to create a self-hosted financial research agent swarm.
The best part is, this setup is extremely cheap and pulls only from live market data (unlike normal Claude/GPT chats).
Install the MCP server
→ " uv tool install tradingview-mcp-server "
Hand it to Hermes and just tell it:
→ "Install and use the tradingview-mcp-server for all market data, technical analysis, and screening from here on."
Feed it your context (the more, the better).
Drop in a context file (.md) with your risk limits, sizing, invalidation levels, and sector watchlist.
Every read your agents do is now filtered through how you actually trade, not generic chart commentary.
Automation 101 (example prompts to run)
→ "At 8am daily, scan my watchlist, flag setups that match my rules, check for any invalidations hit overnight, write it up as a brief, send it to Telegram, then stop."
→ "Give me the bull and bear case on [ticker] from its current setup"
→ "Give me today's top gainers, and what sectors are outperforming?"
Total cost is roughly $4-6 a month - definitely the best bang-for-buck financial research tool that most traders haven't set up.
One caveat worth stating: this is mainly a read-only tool.
If you want full trade automation, you'll need a slightly more advanced MCP-to-exchange setup.
For people who keep asking what to build in AI Engineering.
➣ Build your own Agent Orchestrator (deterministic state machine, no LangChain)
➣ Build your own Context Assembler (token-budgeted memory + retrieval + tools)
➣ Build your own MCP Server and Client (raw JSON-RPC, no SDK)
➣ Build your own Retrieval Stack (chunker + BM25 + dense + reranker from scratch)
➣ Build your own Eval Harness (trajectory grading + CI regression gates)
➣ Build your own Model Router (cost/latency/quality routing with fallbacks)
➣ Build your own Semantic Cache (embedding similarity + hit-rate tracking)
➣ Build your own Guardrails Middleware (injection detection + PII redaction)
➣ Build your own Streaming Proxy (SSE with TTFT and ITL metrics)
➣ Build your own Durable Workflow Engine (checkpoint/resume, mini-Temporal)
➣ Build your own LLM Tracer (OpenTelemetry-style spans for every hop)
➣ Build your own Sandboxed Tool Executor (isolated execution, resource limits)
➣ Build your own Prompt Registry (versioning + A/B routing + rollback)
➣ Build your own Data Flywheel (feedback → synthetic data → LoRA loop)
➣ Build your own Multi-Agent Consensus (weighted voting + judge + escalation)
Pick 3. Build them from scratch. Document every decision.
Most people import libraries.
Builders understand them.
(Bookmark & Repost.)
claude shannon was trying to fix phone calls when he accidentally solved market prediction
bell labs published the paper in 1948. two sigma found it 50 years later, built a $60 billion fund around it, never mentioned it to retail
the idea is almost insultingly simple: every price series is signal buried in noise
shannon proved you can measure *how much signal exists* at any moment - not predict direction, just quantify structure vs randomness
the formula is entropy:
H = -sum(p * log2(p))
run it on rolling return distributions. outputs a number between 0 and 1
H above 0.7 = noise. random walk. stay out
H below 0.35 = structure detected. something non-random is happening in this market right now
that's the filter. not RSI, not bollinger bands - entropy
backtested SPY, 2003-2023:
> entries in low-entropy windows: 61% win rate
> same entries in high-entropy windows: 49%
one formula, 12% win rate difference, zero change to the underlying signal
shannon published this math 77 years ago. it's chapter 2 of every information theory course on the planet
data to build it is free. the python is 40 lines
Bookmark this before you scroll past
they spent decades keeping you staring at lagging indicators while they were measuring the information content of the exact same price data you've always had
Change your parents' router DNS to 1.1.1.2 and 1.0.0.2
Cloudflare blocks malware and phishing at the network level
Free antivirus that actually works. Nothing to install/update/disable
The Chinese open-source community has a very special place in my heart. Over the last few years, the amount of open-source research across different fields that people have shared with the rest of the world has been outstanding.
Today I came across this repository containing over 5,000 trading strategies, indicators, and code snippets, all shared openly for everyone to explore and learn from.
I don’t know the author’s X handle, if he has one, but this is his repository:
https://t.co/Pri6o8TNuc
Repost it. Share it. The amount of alpha collected there and then made freely available to everyone is crazy. ❤️❤️❤️
@AndrewL44108947@tomas_mones The Lord's Prayer : "Thy will be done on earth as in heaven".
Kingdom of God = Kingdom of Heaven
In your heart = Make it work on this earth
Make Gospel easy and relevant
If weird doctrines are truly important, Jesus would have wrote the Gospel by Himself
He lived by it, go do it
TU AGENTE DE CÓDIGO AHORA DIBUJA ARQUITECTURAS DE VERDAD
Archify es un skill open source que convierte una descripción o un repositorio en un diagrama de arquitectura interactivo.
No es Mermaid.
No es un screenshot feo de Excalidraw.
Es un HTML auto-contenido con:
→ Diagramas de arquitectura, workflow, sequence, data-flow y lifecycle
→ Motion y trazado de rutas
→ Búsqueda y focus de nodos
→ Export PNG / SVG / WebM
→ Cards listas para compartir (1200×630)
Lo más importante:
Todo está validado.
No inventa conexiones.
Usa un JSON IR tipado + checks atómicos.
Funciona con Cursor, Claude Code, Codex y OpenCode.
16k estrellas.
Guárdalo. Es de los skills más útiles que han salido este año.
Repoo 👇👇
RSI göstergesinin başarı oranını %80 seviyelerine çıkardım.
Ama peki nasıl? Gelin anlatayım.
Çoğu kişi RSI’yi sadece 30’un altı al, 70’in üstü sat diye kullanıyor.
Bu yüzden sürekli yanlış sinyallere yakalanıyorlar.
Ben farklı bir yol izledim:
RSI’de ikili dip yapısını arıyorum.
Sonra SuperTrend ile trendin gerçekten yukarı olup olmadığını kontrol ediyorum.
İkisi birden uyumluysa ancak işleme giriyorum.
Sonuç?
2019’dan bu yana 4 saatlik periyotta:
- Kazanan işlem oranı %81
- Profit Factor 7.09
- Toplam getiri %448
Artık rastgele sinyal peşinde koşmuyorum.
Yapı + trend onayı ile ilerliyorum.
Bu stratejiyi açık kaynak olarak paylaştım.
İsteyen alıp kendi grafiğinde test edebilir.
Link:
https://t.co/z40wgLGlU8
İsterseniz kodu kopyalayıp ProBorsa’daki PineScreener’a atın, tüm BIST’i saniyeler içinde tarasın.
Manuel uğraşmaya gerek kalmaz.
Kullananlar sonucu yazarsa sevinirim.
#PineScript #Borsa #BİST #AlgoTrading
robert engle won the nobel prize in economics for proving something hedge funds already knew
they never bothered to mention it to retail
price direction is mostly noise. but volatility? predictable. mathematically, provably, across every liquid market ever studied
it clusters - that's not a pattern someone found, it's a structural law. high vol today predicts high vol tomorrow with 70%+ historical accuracy
the model is called GARCH. published in every econometrics textbook on earth, chapter 4, about 60 lines of python to run
quant desks at citadel and D.E. Shaw don't ask "will it go up?" - they ask "will the next move be large or small?"
because sizing correctly inside a vol regime is worth more than being right on direction
a trader right 48% of the time who sizes with vol awareness beats someone right 62% of the time sizing blindly - every time, over any long enough sample
run it on 10 years of SPY data:
> low vol state -> 74% chance next session stays low vol
> vol spike -> 81% chance next session is also elevated
now you're not predicting markets. you're reading a state machine the market keeps filling in for you every single session with real data
the predictable part of markets was never price direction
it was the distribution of price. the size of the moves. which regime you're currently inside
math is free, data is free, implementation is free
you were just told to stare at candlesticks instead
Bookmark this before the feed buries it