Options 101: The Foundation
Topics covered:
1.) What is a derivative?
2.) What is an option?
3.) Options example ( airline industry )
4.) Options example ( $BTC )
5.) American vs European options
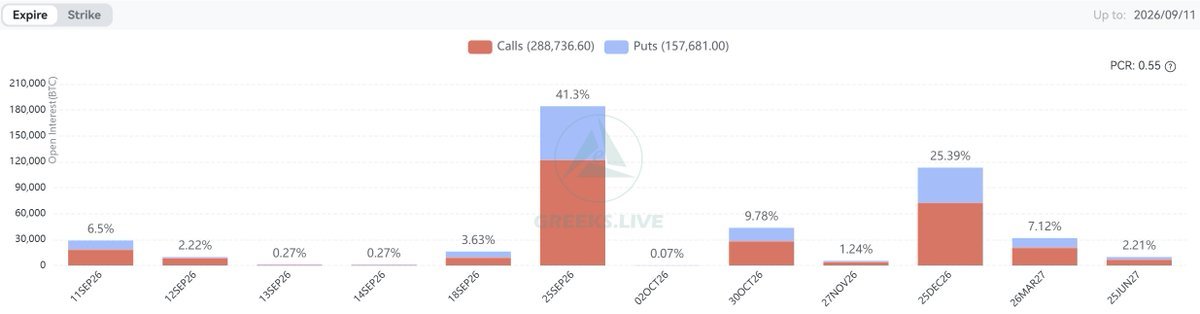
September 11 Options Expiration Data
29,000 BTC options expired, with a put-call ratio of 0.6, a maximum pain point of $78,000, and a notional value of $2.24 billion.
114,000 ETH options expired, with a put-call ratio of 1.17, a maximum pain point of $2,450, and a notional value of $280 million.
Bitcoin continues to consolidate around $80,000. After a three-day rally in late last month that pushed it to $80,000, it has been trading sideways for nearly three weeks now. As expected, Bitcoin’s price swings are completed in a very short period, followed by a prolonged sideways consolidation. Monthly realized volatility (RV) remained unchanged from last week, while monthly implied volatility (IV) rose slightly, and VRP across most maturities saw widespread increases.
Looking at other key options data, 7% of options expired this week. Open interest for BTC and ETH declined slightly compared to last week, and overall trading volume also saw a moderate pullback. The Gex on the upside continues to converge, with call selling positions gradually accumulating above $78,000; $80,000 remains the peak. On the downside, the Gex is also beginning to cluster around $77,000, marking an end to the previously completely dispersed pattern.
After a 10-month bear market, the gains for major cryptocurrencies in this bull run were primarily concentrated in a single week last month. However, during the pullback, some concept coins and meme coins showed signs of recovery, which is a positive signal. The brief lull in the U.S. stock market has also provided the crypto market with a window to catch its breath. Market sentiment is very optimistic, and with monthly out-of-the-money implied volatility (IV) currently low, it is still worth making some directional buys.
September 4 Options Data
29,600 BTC options expired, with a put-call ratio of 0.65, a maximum pain point of $73,000, and a notional value of $2.39 billion.
139,000 ETH options expired, with a put-call ratio of 0.9, a maximum pain point of $2,400, and a notional value of $350 million.
After a sharp rally two weeks ago, Bitcoin has continued to consolidate around the $80,000 level, often experiencing rapid short-term gains followed by a slow sideways decline, in a recurring cycle. Monthly realized volatility (RV) continued to rise compared to last week, reaching 40%, while monthly implied volatility (IV) turned downward to 36%. The 15-day VRP briefly fell to -16% yesterday but has since rebounded to -6%, though it remains significantly lower than last month’s high of 15%.
Looking at other key options metrics, 7% of options expired this week. BTC open interest rose, while ETH open interest declined slightly, and overall trading volume surged significantly. The Gex for call options has gradually converged from a dispersed state, with positions selling calls above $80,000 gradually clustering; the Gex for put options is virtually negligible.
After a 10-month bear market, the current bull run has lasted nearly three weeks. The brief lull in the U.S. stock market has also provided the crypto market with a window to catch its breath. Market sentiment is very optimistic, and with monthly implied volatility (IV) currently low, it remains worthwhile to make some directional buys.
Today I saw people discussing Strategy resuming its crypto purchases. This kind of short-term stimulus doesn’t affect the long-term trend, and Strategy is just another big “sucker” anyway. It’s no longer possible to manipulate the BTC market, and no one can predict its direction.
All I can say is that now that Strategy has unrealized gains, it has more room to buy coins. Looking at the long-term trend, ETFs are still seeing overall outflows; it’s very difficult for BTC to hold steady above 80K, and selling pressure is heavy.
On the macro front, whether it’s the Fed’s hawkish rhetoric or the escalating U.S.-Iran tensions, these factors are testing investors who are already on thin ice.
Short-term volatility is dropping rapidly, and a single bullish candle is hardly enough to sustain a bull market. Hopefully, after a slight pullback, prices can reach above 85K; otherwise, arbitrageurs and sellers will create significant selling pressure. With Gex gathering momentum at the end of the month, we need to keep this momentum going.
It’s only when a major market move hits that you can truly tell how effective an options risk management system is.
In the past, when reviewing an account, I only knew how much profit I’d made that day. Now, with Pro Risk Analytics, I can break down the daily P&L directly into:
Delta, Gamma, Theta, Vega, Skew, Smile, and the Residual—which the model cannot explain.
On the day Bitcoin surged, the account made money through bull spreads and futures, but typically you can only see the total P&L. The most valuable insight isn’t this number—it’s being able to answer:
Was this profit driven by Delta?
Or by Gamma, Skew, or Smile?
How much of it does the model explain?
How much of the P&L remains unexplained?
Especially during periods of extreme volatility in BTC, this type of P&L attribution and SABR Greeks exposure becomes extremely valuable.
It goes beyond “how much was made today” to reveal “why it was made and where the risks lie.”
For options traders, this is what truly constitutes useful risk analytics.
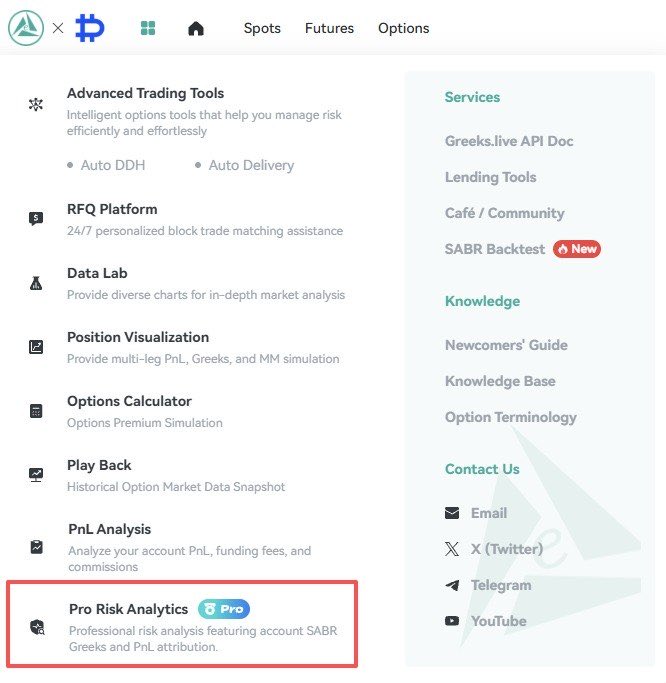
Greekslive recently launched the Pro Risk Analytics feature, an institutional-grade tool for options portfolio management that makes positions reflect market risk more accurately under the SABR model.
In the past, we used the BSM model to calculate Greeks, but there has always been an issue in the options market: implied volatility (IV) is a surface rather than a fixed value. The SABR model is specifically designed to describe the dynamics of the volatility surface, calculating the “total risk exposure of the entire options portfolio.”
In our Pro Risk Analytics system, we can calculate numerous second-order exposures and complex parameters for your current positions, providing a risk profile under the SABR model that more closely mirrors real-market conditions. This is why we’ve been actively promoting SABR recently—to provide you with a true institutional-grade tool. If you’re a market maker, you’ll be able to determine exactly where today’s P&L comes from: Delta, Gamma, Vega, Theta, Skew, or other factors.
We’ve already added 38 features for you to use. If you have any questions or want to share your experiences, feel free to send me a private message or tag me in a post—let’s learn together how to use SABR.
Our first question: Is the profit from selling options really just Theta?
August 21 Options Data
24,000 BTC options expired, with a put-call ratio of 0.84, a maximum pain point of $67,000, and a notional value of $1.82 billion.
149,000 ETH options expired, with a put-call ratio of 0.84, a maximum pain point of $2,000, and a notional value of $360 million.
Bitcoin surged significantly this week, breaking through the 76K level and breaking out of two sideways price ranges this year. This was one of the few expiration dates this year where the settlement price exceeded the maximum pain point. Monthly realized volatility (RV) jumped 20% to 53%, while monthly implied volatility (IV) rose only 6%; currently, VRP has dropped sharply.
Looking at other key options metrics, 6% of options expired this week. Open interest rebounded but remains at low levels, while trading volume surged significantly. The rapid pace of the rally and the sharp increase in trading activity have caused Gex in the call direction to be highly dispersed, while Gex in the put direction is virtually negligible—the market is in a state of widespread long positions.
After a 10-month bear market, cryptocurrencies have finally seen a substantial rally, and market sentiment is extremely optimistic—one could say a single bullish candle has shifted market sentiment. Currently, monthly out-of-the-money IV remains low, making it worthwhile to make some directional buys.
Greekslive’s newly launched Pro Risk Analysis is a highly powerful, advanced professional risk analysis tool for factors. It is currently available for free, and you can also redeem GLV points to unlock additional usage opportunities.
This feature is part of the Pro version and requires you to be logged into both your Deribit and Greekslive accounts and to apply for Pro access.
Activation takes place within one business day after your request, so even if you’re not yet familiar with the tool, you can go ahead and activate it. Once activated, you’ll be able to analyze advanced and complex factors—going a step beyond the standard Greeks breakdown.
We invite you to join https://t.co/aavAwWeMrK, the hottest Telegram group for crypto options discussions, where 12,000 members are actively exchanging ideas!
A portfolio can show little net Vega and still carry meaningful volatility surface risk.
In multi-leg strategies, exposures can offset at the aggregate level, making it harder to see where risk currently sits—and what actually drove P&L.
Pro Risk Analysis combines SABR-based volatility surface metrics with two complementary views:
Account Greeks show the portfolio’s current real-time exposures.
P&L Attribution breaks down model-explained P&L into Skew, Smile, Vega, Vanna, Volga, and Theta, with attribution available by expiry.
These views help uncover skew and smile risk, as well as second-order exposures such as Vanna and Volga, that net Vega alone may miss.
Pro Risk Analysis is now live on GreeksLive Web. Start your 30-day free trial: https://t.co/GrVjKpnNn6 | https://t.co/lSDC5rfWlS
Web 2.1.8: Pro Risk Analysis is live.
Near-zero net Vega doesn’t necessarily mean limited volatility surface risk.
See what aggregated Greeks may miss with:
• SABR-based Skew Greek
• P&L attribution across Skew, Smile, Vega, Vanna, Volga & Theta
• Risk breakdown by expiry
https://t.co/GrVjKpolcE | https://t.co/lSDC5rgubq
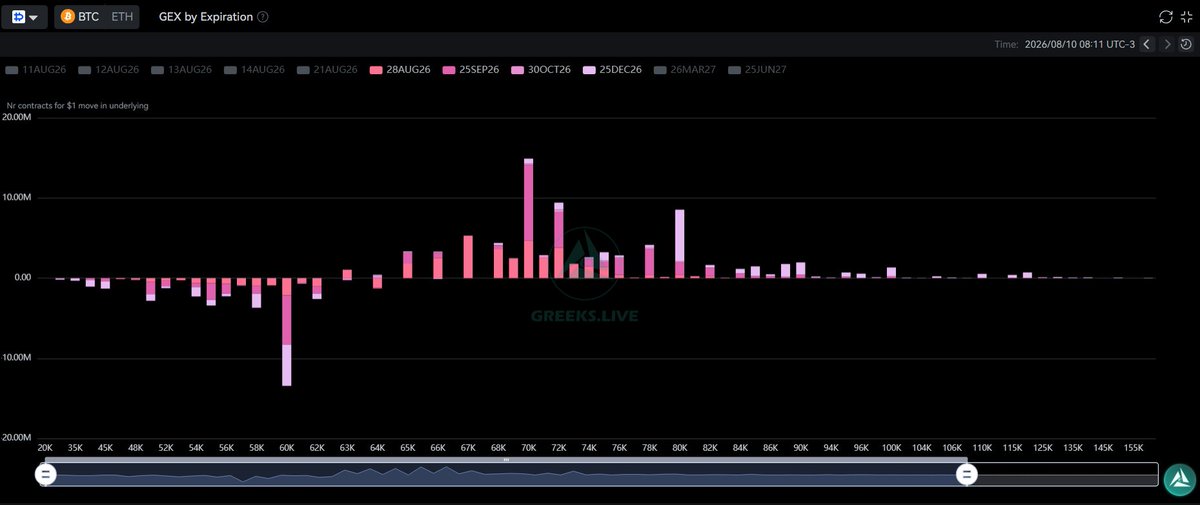
BTC options positioning remains concentrated across the $65k–$80k region, with the largest positive gamma exposure centered at $70k. Additional concentrations are visible around $67k–$68k, $72k, $78k, and $80k, leaving the positive gamma profile distributed across several nearby strikes but dominated by the $70k node.
Below this range, negative gamma remains concentrated primarily across the $50k–$62k area, with the most significant exposure located at $60k. This creates a clear separation in the current GEX distribution between negative gamma at lower strikes and positive gamma from the mid $60k region upward.
Across expirations, the larger concentrations are primarily associated with August, September, and December maturities. The $70k concentration includes exposure across multiple expiries, while several of the higher strike gamma positions show a greater contribution from longer dated contracts.
Overall, the current GEX profile is characterized by a dominant $70k positive gamma concentration, secondary positioning through $72k–$80k, and a comparatively concentrated negative gamma pocket around $60k. The majority of observed gamma exposure remains clustered within a relatively narrow set of strikes between the low $60k and low $80k region.
Important to note that these do not include IBIT data