#TOTAL3
Alts are still bleeding, but structurally this is not the same as the last cycle.
The big difference is simple:
This time, the market never got the clean macro breakout.
In the prior cycle, alts broke out, expanded hard, then rolled into a much deeper reset and a long 18-month consolidation.
That kind of breakdown makes more sense after a true expansion phase.
This time, that expansion never really came.
Price pushed into the macro resistance region, failed there, and rolled over without ever getting the decisive breakout that would justify a full cycle blow-off and reset.
That’s why the damage, while still ugly, has been significantly less severe so far.
A market that failed before breakout usually doesn’t need the same magnitude of downside unwind as a market that already had its full expansion and euphoria phase.
That doesn’t make alts bullish here. Most will continue their downtrend over the coming months, and the useless ones will likely never recover.
It just means this still looks more like a macro uptrend under pressure than a completed cycle topping structure.
And because the breakout failed before the real expansion phase could begin, there’s also a decent argument that this consolidation period may not need to drag on as long this time either.
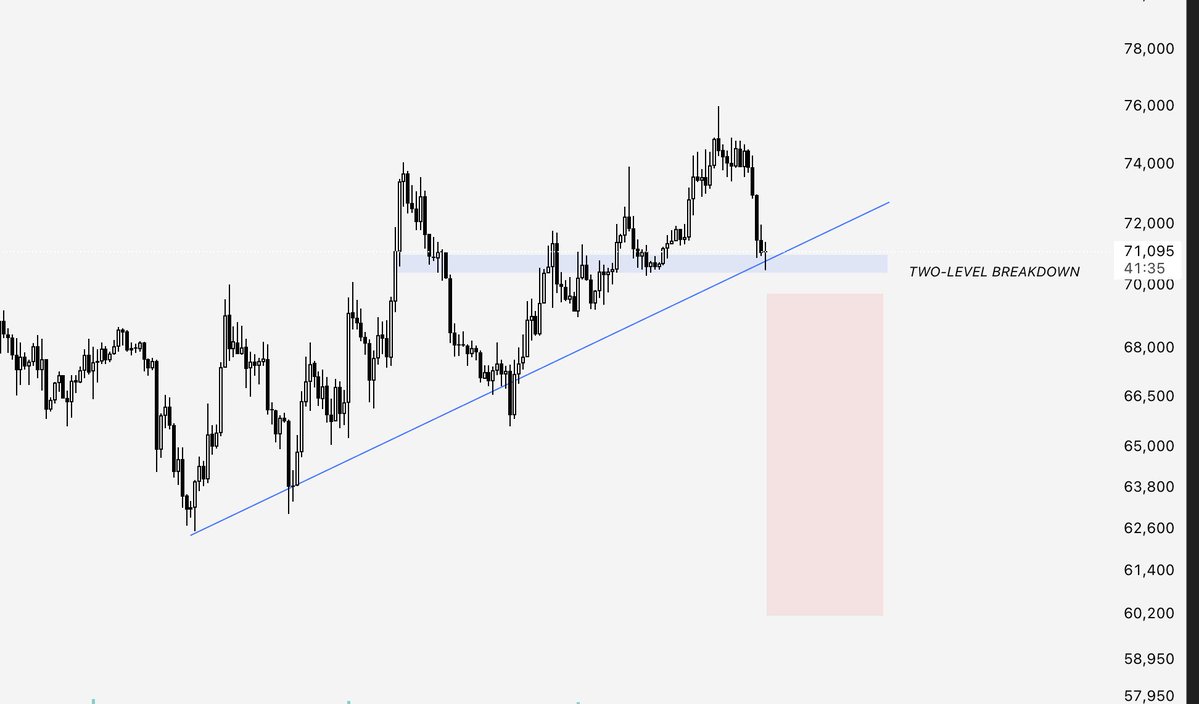
$BTC now testing the most critical level of this entire rally.
$70-71K. The exact area we marked yesterday.
Why does this level matter?
Trendline support and horizontal support both sit right here, making it a two-level support zone. When two structures converge like this, the hold matters twice as much and the break matters twice as much.
Lose this and you're not just losing a trendline. You're losing the structure that's been holding this entire rally together.
⌛️
$BTC
Everyone is focused on the price right now. But the most important variable in this range is actually time.
Let me explain.
The first range of this downtrend at was 55 days, ~21%. The second one is 22 days in, ~20%. Still active.
The size of a range reflects how far price needs to move to transfer stock between participants. The duration reflects how long that transfer takes.
A long range means there's a battle. Real demand meeting real supply. It takes time for one side to overwhelm the other. A short range means one side is dominant and the other is just providing liquidity.
The first range took 55 days. Buyers were present. It took the sellers nearly two months to absorb all of that demand before the breakdown.
The second range is 22 days in. Same size.
If it breaks down faster, demand is weakening at each level. Sellers need less time. Less cause, same effect.
If it takes longer or breaks up convincingly, demand is stronger at these levels and that zone becomes meaningful support on any future revisit.
Price levels get all the attention. But the duration of this range will tell you more about what comes next than any price target.
⌛️
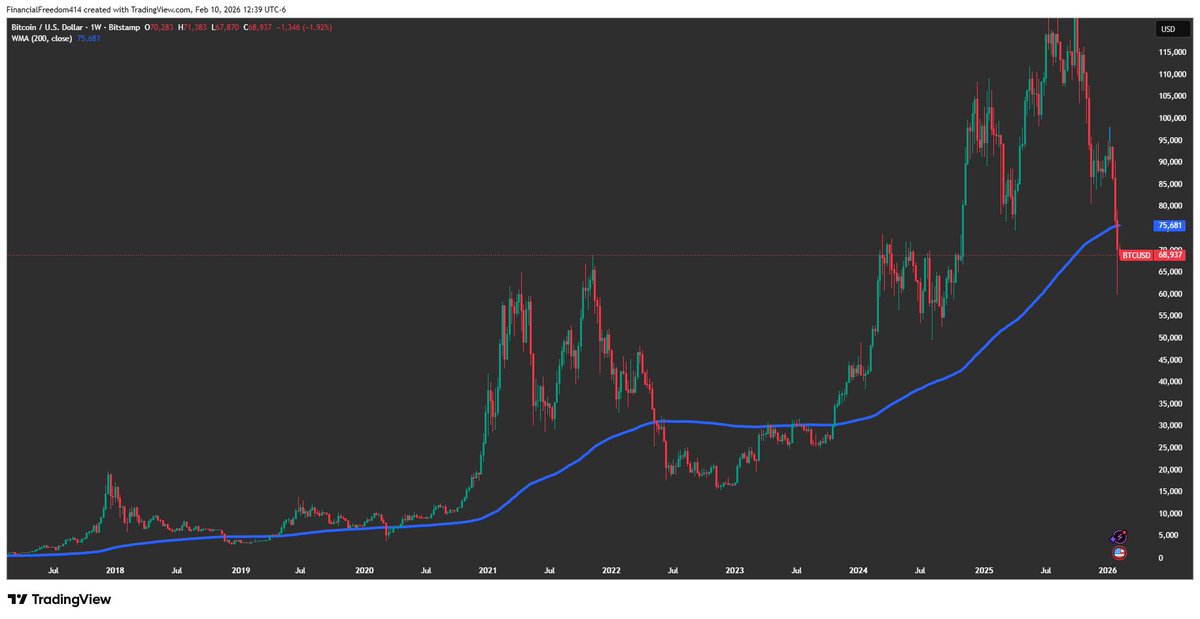
BITCOIN IS ACTUALLY SO EASY
PRICE BELOW MA200 -> ACCUMULATE
PRICE BREAKOUT ABOVE MA200 -> SELL
USE THIS AND YOU WILL BEAT 90% OF TRADERS IN 2 YEARS
$BTC
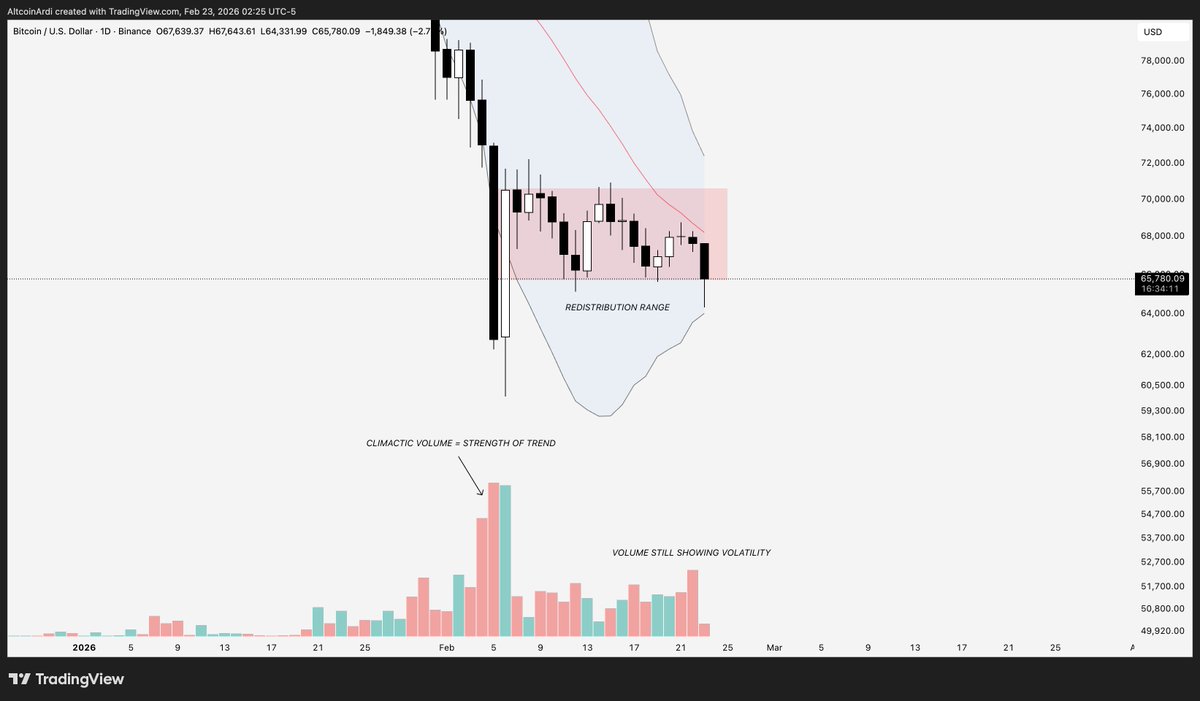
After the big volume sell off at $60K, everyone started calling the bottom.
That's not how bottoms work. The selling climax only stops the bleeding. It doesn't reverse anything, and it actually shows you how strong the downtrend is.
After the big flush you still need the bounce, the retest, months of range building, the shakeout that wipes out the last sellers, and then confirmation that buyers actually have control.
That's 5 phases. Most of them take months. We haven't even started.
Look at what happened after the climax. Price bounced into a range between $66-71K. Volume never dried up, and actually increased inside the range.
That's not signs of accumulation for a reversal. In a real bottom, volume decreases as the range develops because sellers lose interest. Here, sellers stayed active the entire time.
Big volume at the bottom of a move means one thing. The move stopped. Not that it suddenly reversed.
Massive difference between the two, and most people have no idea.
#Bitcoin
$BTC
It's us versus the world once more.
Not to say I will be right,
Since my X-istence, I have been wrong about 10% of the times (see receipts on my timeline).
But the fact they all want 50k, or just a lower low in Q4, is clear.
That is just my beyond obvious observation.
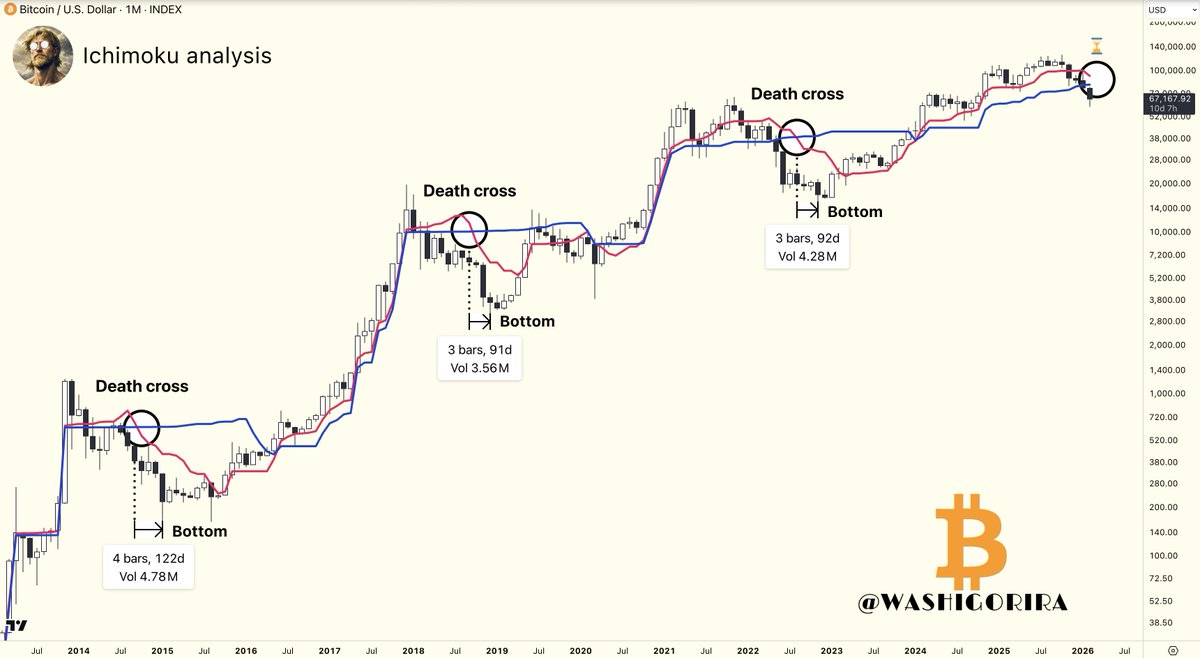
#Bitcoin Death Cross
In previous cycles, BTC bottomed 3–4 months after the Ichimoku monthly death cross.
The death cross has not formed yet.
Structurally, this suggests it may still be early.
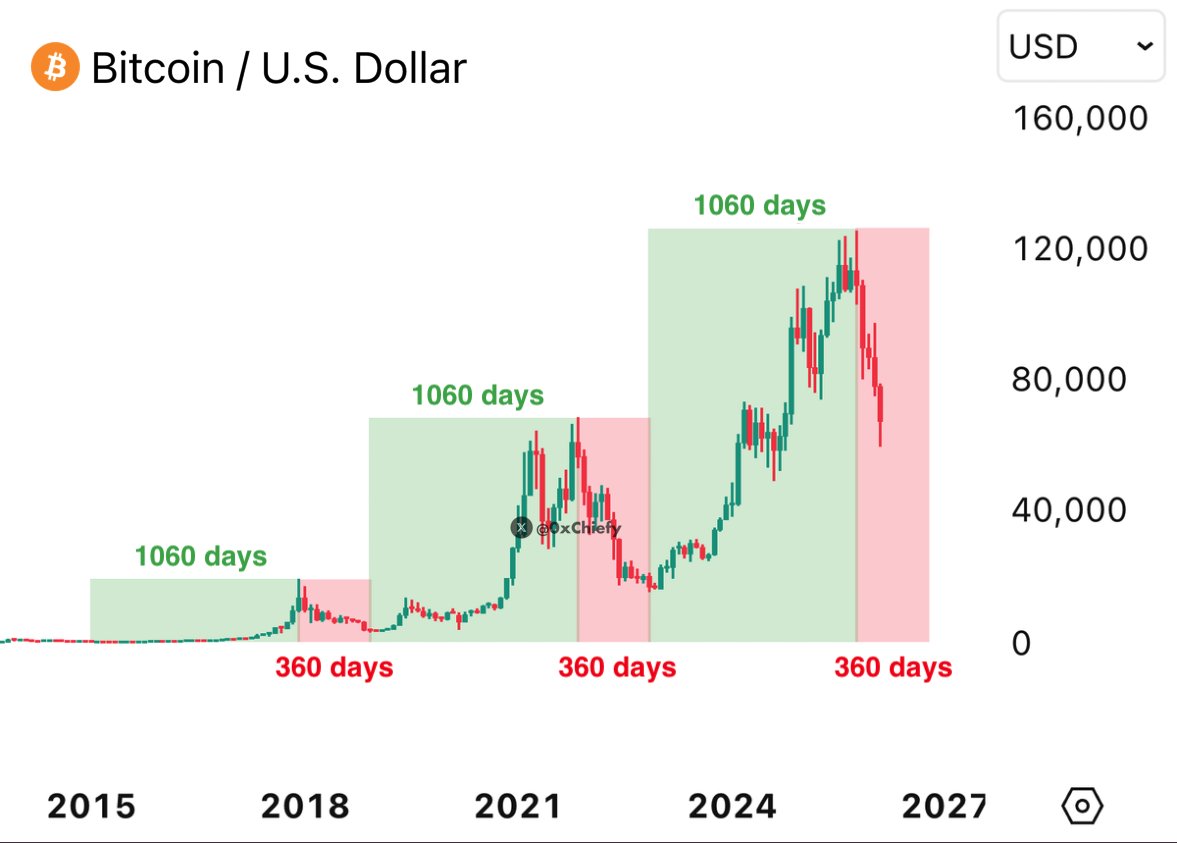
Historically, bear markets last around 360 days.
We’re only 135 days into this one.
If history repeats, $BTC could drop to $35,000 before a reversal.
Position accordingly.
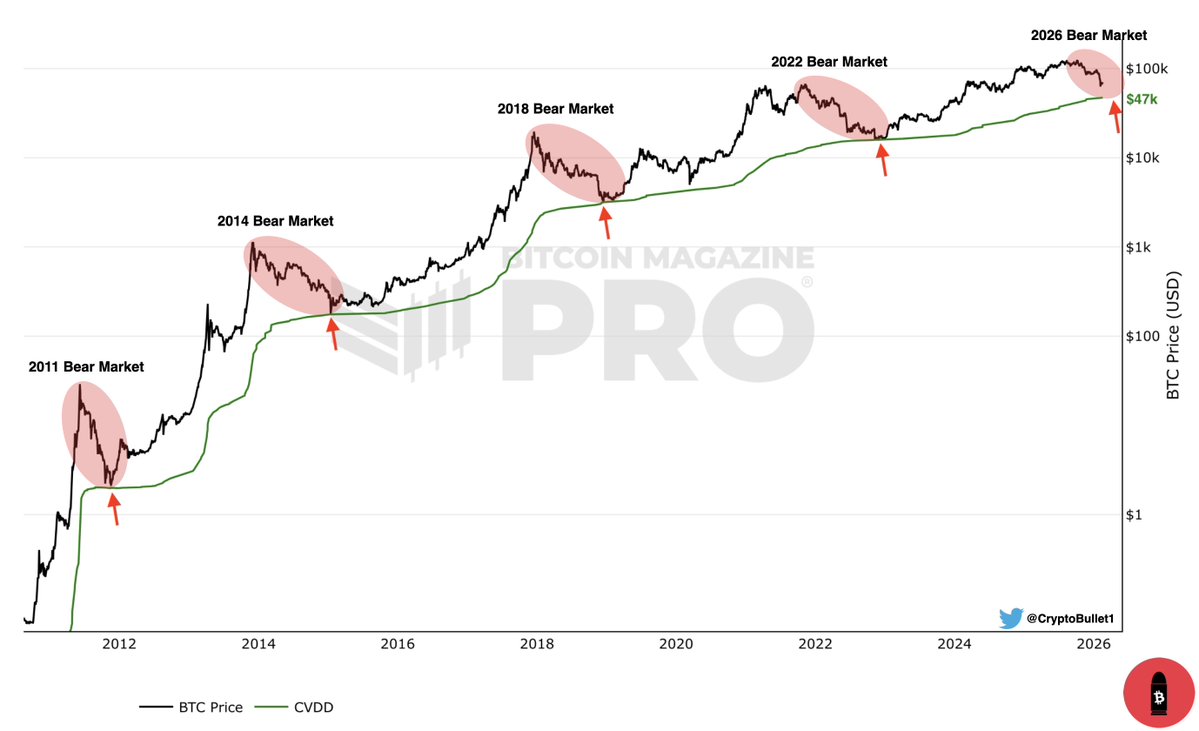
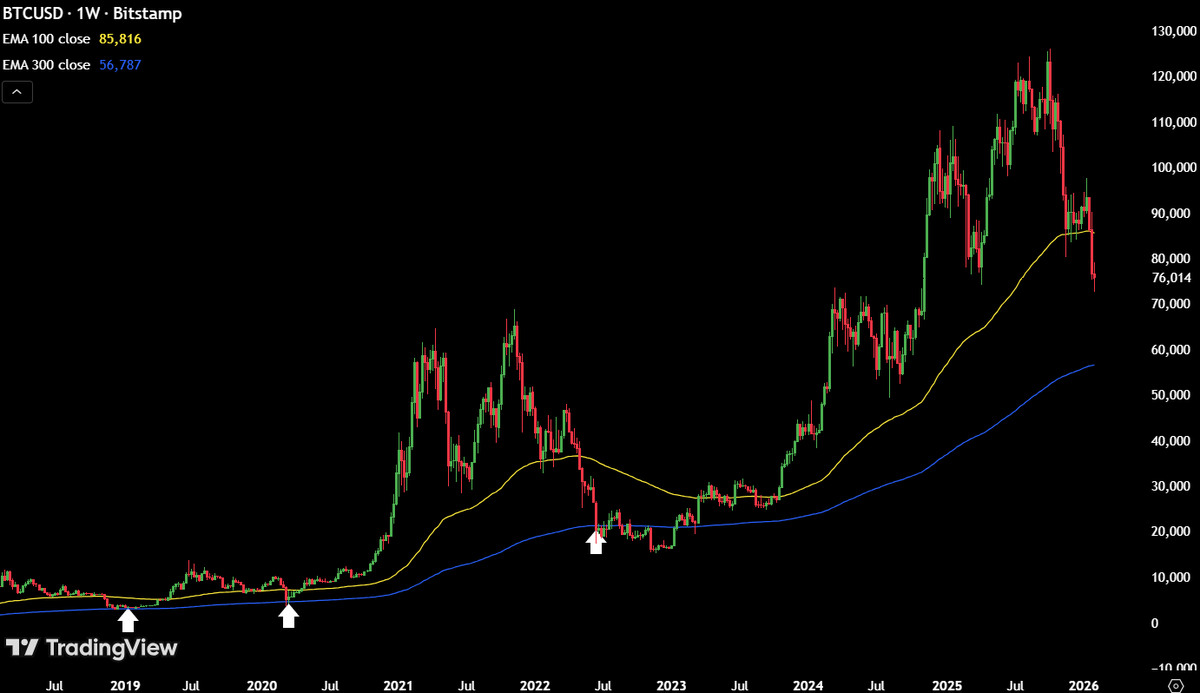
Every bear market $BTC tests the CVDD price and it acts as the ultimate support (bear market bottom)
That’s how I managed to perfectly catch the bear market bottom in 2022 🎖️
👉 Currently CVDD is at $47k - exactly where I have my next $BTC target (1.618 Fib & Aug ’24 Low)
And I think this year $BTC will break below the CVDD price for the first time in history, just like #BTC broke below the 200-Week MA for the first time in history in 2022
$BTC
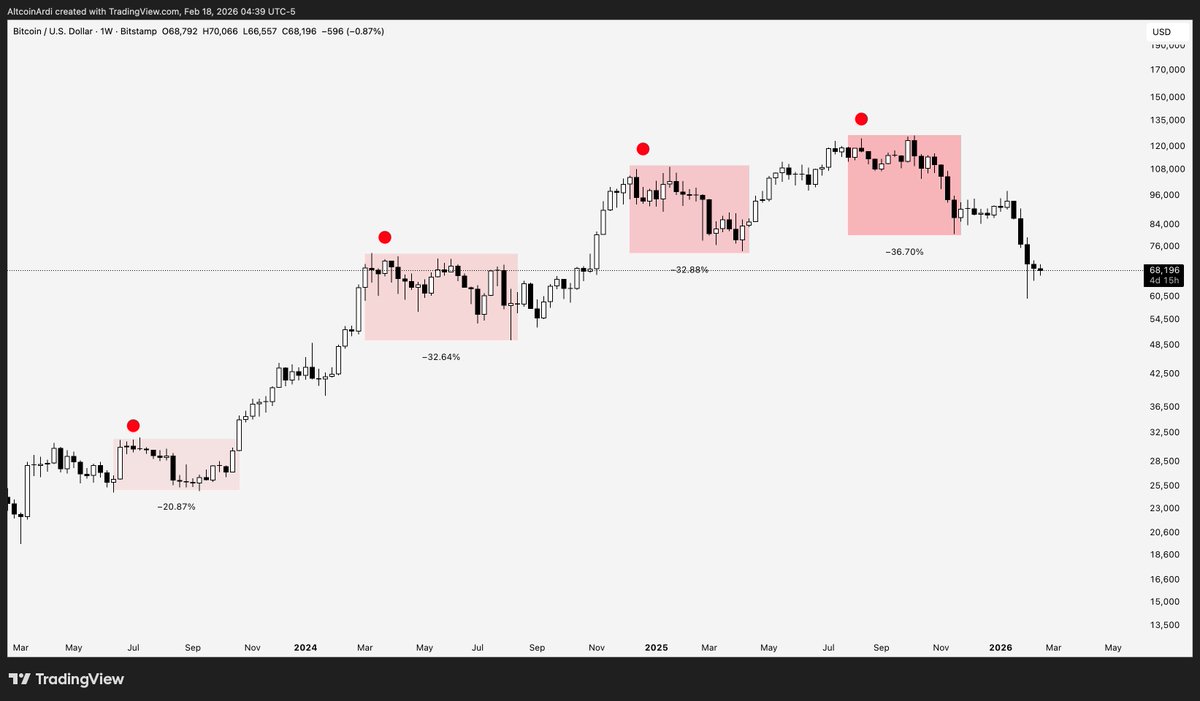
Nobody seems to be telling you this, so I will.
When the corrections start getting deeper every time during a bull run, you're watching the top confirm itself.
-20.87%
-32.64%
-32.88%
-36.70%
These aren't random pullbacks. These are the four major correction pivots of this entire cycle.
Every correction went deeper than the last. Sellers took back more ground every time. Price kept making new highs so nobody paid attention.
But the trend's health isn't measured by new highs. It's measured by how deep the corrections get.
By the time that fourth correction hit -36%, the uptrend was done.
One of the simplest ways to track when a bull run is exhausting itself. Make sure you remember it for the next cycle.
#Bitcoin
This is exactly what you see at bottoms.
Let us get this straight.... we have Deustche Bank coming out and saying "Bitcoin is no longer Digital Gold" when...
1. BTC/GOLD has put in 7 monthly red candles
2. BTC has put in 5 monthly red candles
3. GOLD has 13 out of 14 green monthly candles
4. Most oversold 1M RSI on BTC/GOLD ever
Whilst BTC/GOLD and BTC sit on monthly trend support.
Narrative follows price, always.
This is why you have to use these narratives as opposite indicators.
Normies will see this on TV, look at Bitcoin being down, feel very scared, and sell it.
When in reality, the risk/reward on buying Bitcoin against Gold hasn't ever been better.
Look, I’m as bullish as it gets and while a “V” shaped recovery here is still possible, I’m not gonna lie, things don’t look great — you should be at least considering how you’re going to pay for life for the next 1-2 years.
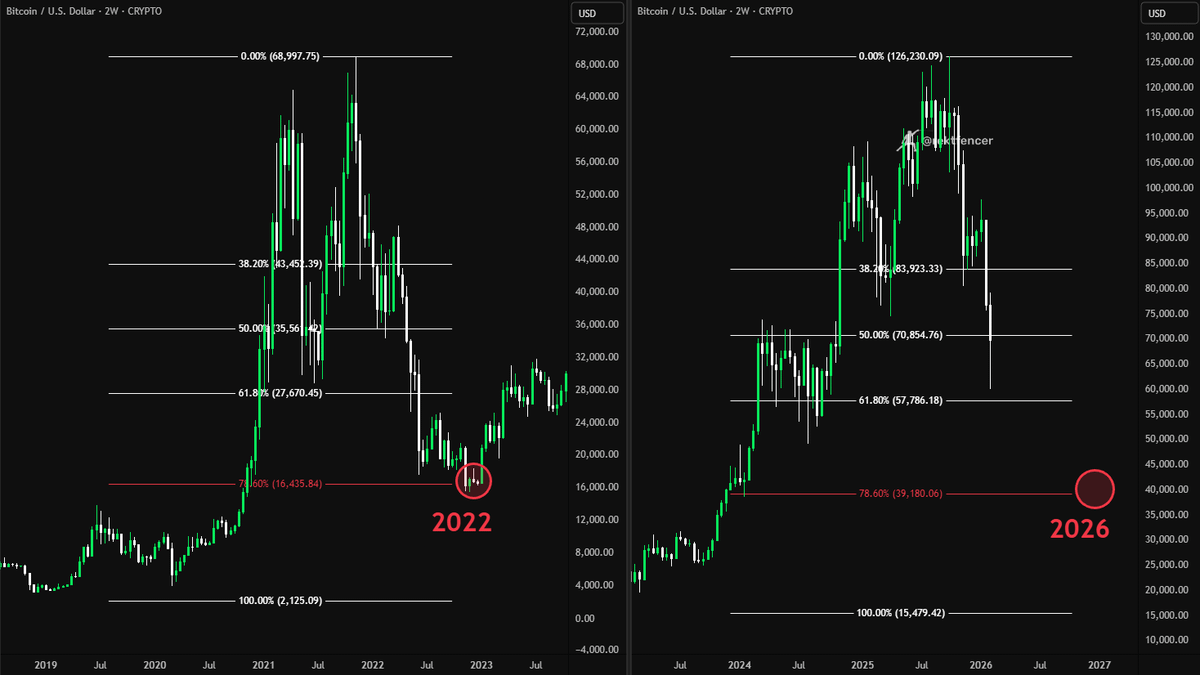
BITCOIN FIB REALITY CHECK.
$126K ATH × 0.382 = $78K
That level had to hold.
It didn’t.
Now the 0.618 retrace comes into play $48K.
That’s not emotion.
That’s structure.
Lose $48K on a weekly close?
Then $35–36K becomes structurally viable.
Risk first. Always.
Everyone loves to play the blame game in bear markets, but Bitcoin has always topped in Q4 of post-halving years.
People want a narrative, but narrative follows price.
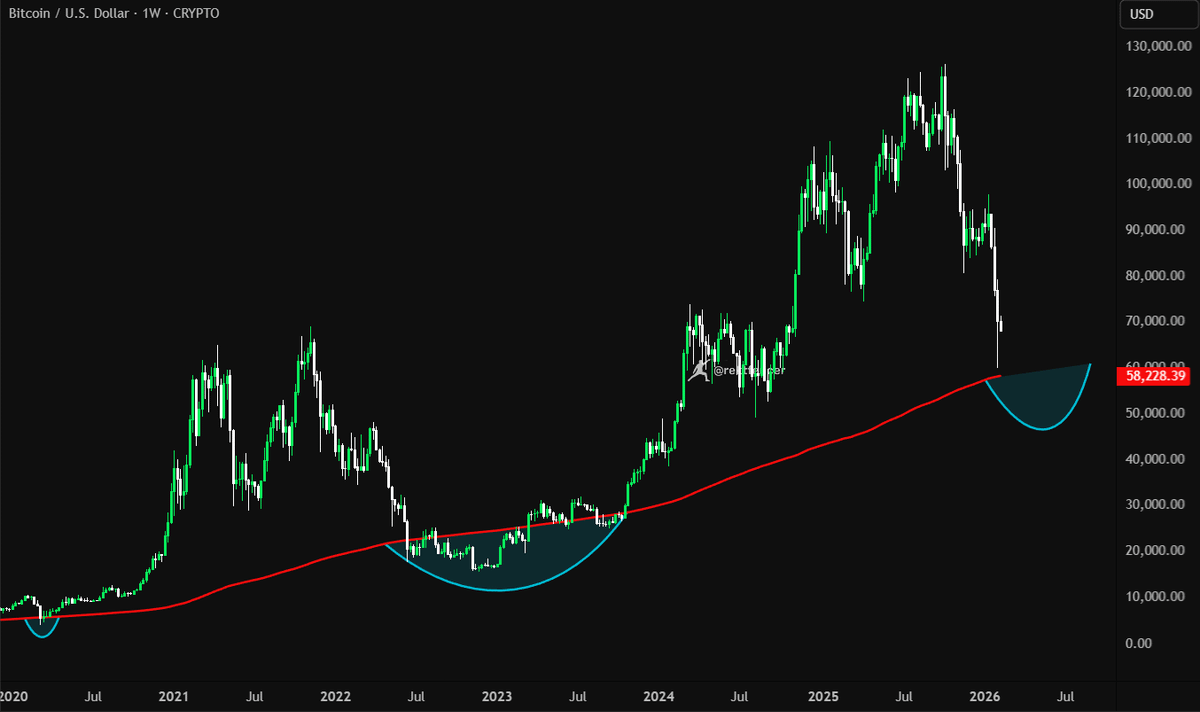
I love simple charts.
Whenever Bitcoin is trading below the 200 WMA you should be aggressively accumulating...unless you hate money.
Thank you for your attention on this matter.
$BTC
Many are asking me when bounce?
My answer is simple.
The 1st bounce will be the fake bounce. (should be soon) and $80k looks like a good initial target on the pullback.
The dump will then continue deeper than most expect.
The real bounce should be at macro 5 wave finish between $60k-$65k. This is based off proportionality of the waves and good support in the high volume area from before US elections in 2024.
Potential for a nice relief dead cat rally towards $100k to get the bulls attention back.
https://t.co/xiVo6JZUbX