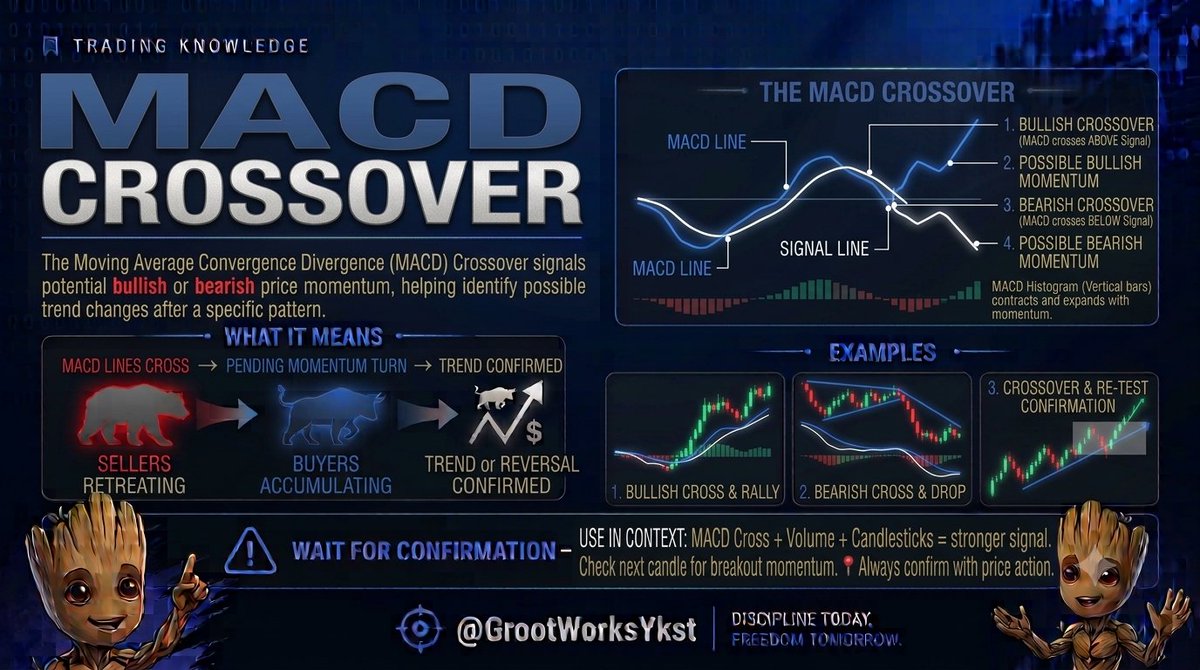
📌 MACD Crossover 📊
MACD line crosses above the signal line → possible bullish momentum.
MACD line crosses below → possible bearish momentum.
⚠️ Always confirm with price action.
📌 Support & Resistance
Support = buyers may step in.
Resistance = sellers may step in.
🔑 These levels can help identify potential entries, exits & breakouts.
📌 Liquidity Sweep 💧
Price briefly breaks a previous high/low, triggers orders, then reverses.
This is called a liquidity sweep.
Watch for:
📍 Key levels
🕯️ Rejection
📈 Reversal confirmation
📌 VWAP Strategy 📊
Price above VWAP → buyers may have control.
Price below VWAP → sellers may have control.
Use VWAP with price action + volume for confirmation.
⚠️ No indicator works alone.
📌 Double Bottom Pattern
Price tests a support zone twice and forms a “W” shape.
🔼 Break above the neckline → possible bullish confirmation.
Wait for the breakout.
📌 3-White-Soldiers 🕯️
3 strong bullish candles in a row = Three White Soldiers.
📈 Can signal strong buying momentum after a downtrend.
Best used with market context + confirmation.
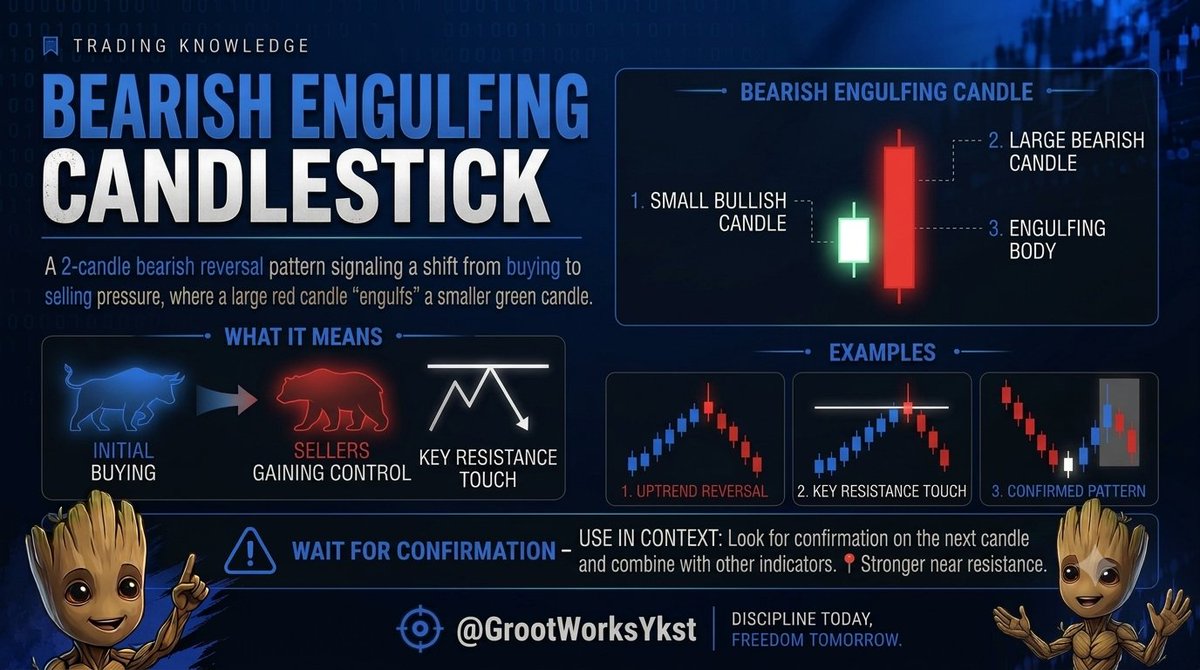
📌 Bearish Engulfing 🕯️
A small bullish candle is followed by a larger bearish candle that engulfs it.
➡️ Shows sellers gaining control
📍 Stronger near resistance
Wait for confirmation.
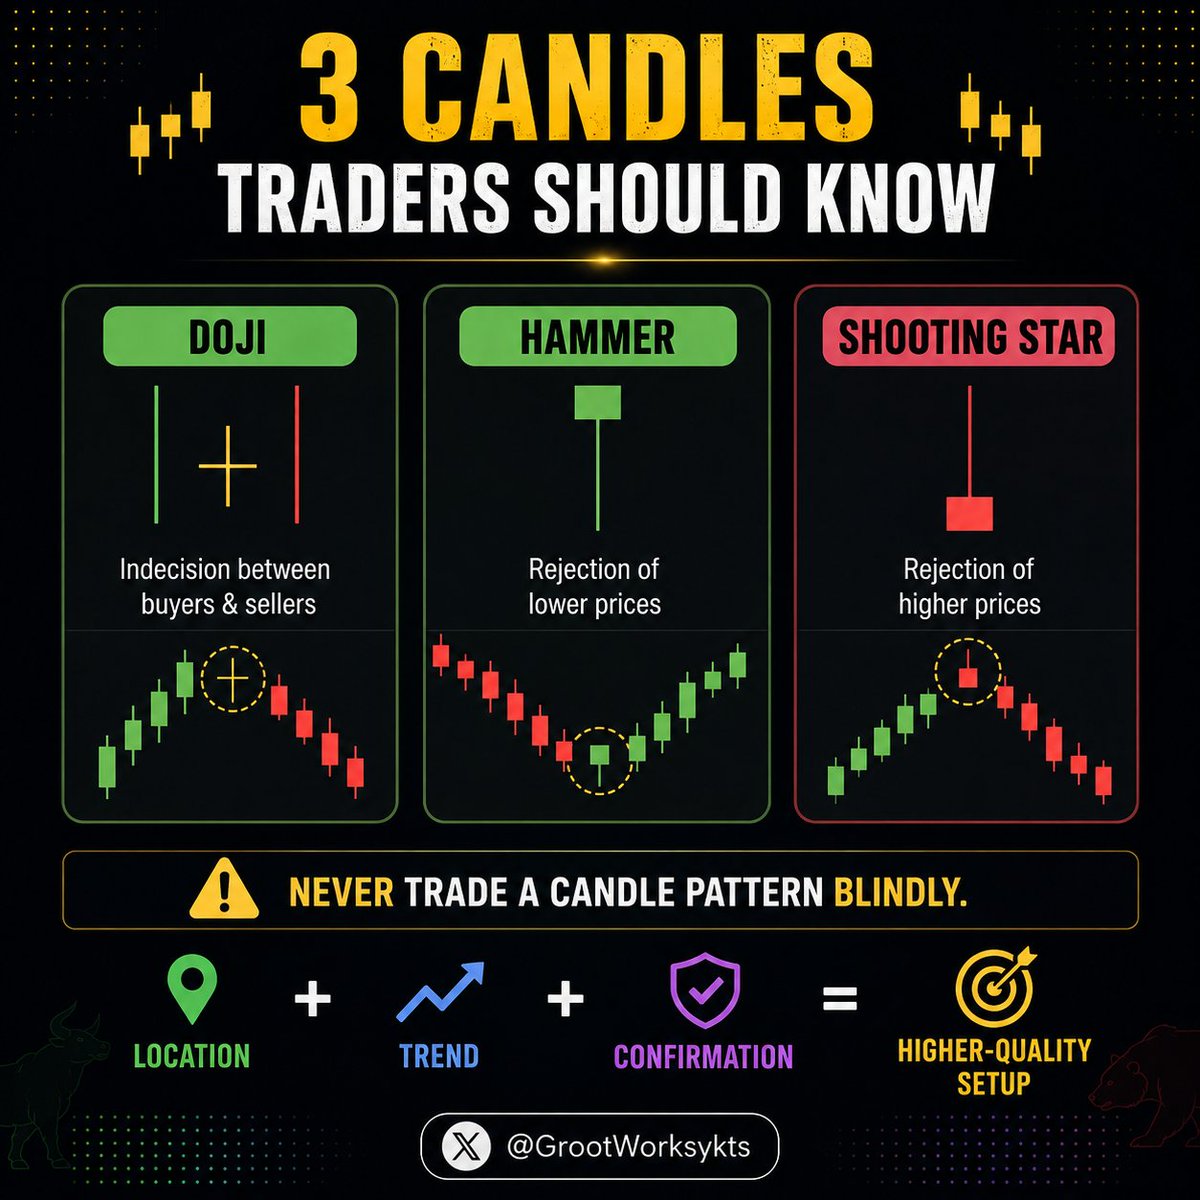
📌 Shooting Star 🕯️
Small body + long upper wick = Shooting Star
It shows rejection of higher prices and may signal a bearish reversal, especially near resistance.
Wait for confirmation before entering.
📌 Hammer Candle
A small body + long lower wick = Hammer 🕯️
It shows rejection of lower prices and may signal a bullish reversal—especially near support.
Always wait for confirmation.
📌 Morning Star Pattern
3-candle bullish reversal setup:
🔻 Strong bearish candle
⚪ Small-bodied candle
🟢 Strong bullish candle
It can signal a shift from selling pressure to buying pressure.
Best near key support.
📌 RSI Divergence
Price makes a higher high, but RSI makes a lower high → Bearish divergence.
Price makes a lower low, but RSI makes a higher low → Bullish divergence.
⚠️ Use divergence with price action for confirmation.
📌 Doji Candle
A Doji forms when the open and close are nearly the same.
It signals indecision between buyers and sellers.
⚠️ Don’t trade it alone—wait for confirmation from the next candle + market context.
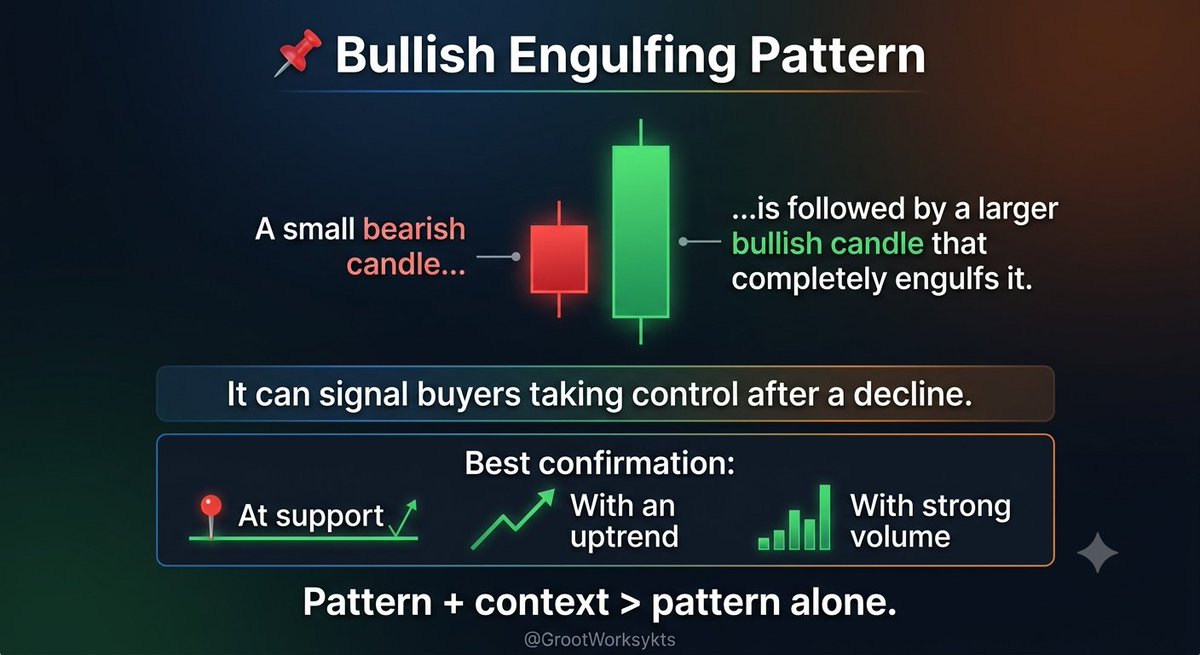
📌 Bullish Engulfing Pattern
A small bearish candle is followed by a larger bullish candle that completely engulfs it.
It can signal buyers taking control after a decline.
Best confirmation:
📍 At support
📈 With an uptrend
📊 With strong volume
Pattern+context>pattern alone.
📌 Inside Bar Strategy
An Inside Bar forms when a candle stays completely within the range of the previous candle.
It shows market compression.
🔼Break above the mother candle → bullish signal
🔽Break below- bearish signal
Best used with the trend + key support/resistance.