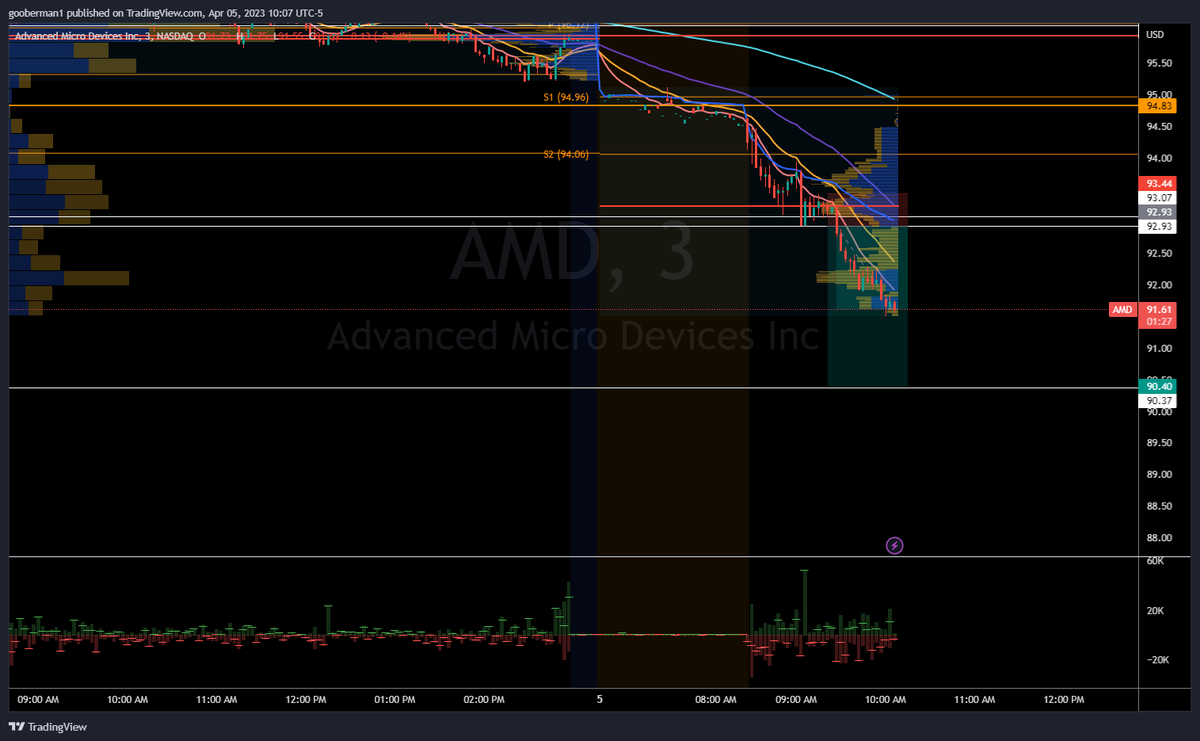
Seeing this message come in today made my day. Nothing makes me happier than seeing my students and mentees prosper from our sessions.
#tradereducation#daytrading $SPY $QQQ $ES $NQ
Continuous Learning: As a new day trader, commit to continuous learning and improvement. Stay up-to-date with the latest technical analysis techniques to refine your trading strategies. #NeverStopLearning 📚
Confluence Zones: Identify areas where multiple technical analysis tools align to form confluence zones. These areas can offer high-probability trade setups with reduced risk. #ConfluenceZones 🔥
Price Targets: Set price targets based on technical analysis patterns and indicators. This can help you lock in profits and minimize emotional decision-making. #PriceTargets 🎯
Trading Ranges: Recognize trading ranges by identifying horizontal support and resistance levels. Trading ranges offer opportunities to buy at support and sell at resistance. #TradingRanges 🔄
Multiple Confirmation: Strengthen your trade setups by using multiple technical analysis tools to confirm entry and exit points. This helps to minimize false signals and improve trade accuracy. #MultipleConfirmation 🔍
Breakouts & Breakdowns: Identify breakouts and breakdowns by monitoring price action as it moves beyond established support or resistance levels. This can signal a new trend or a continuation of an existing one. #BreakoutsBreakdowns 🚀
Risk Management: Combine technical analysis with solid risk management principles to protect your trading capital. Use stop-losses and position sizing to minimize losses and maximize gains. #RiskManagement ⚖️
Backtesting: Test your technical analysis strategies on historical data to gauge their effectiveness before deploying them in live markets. #Backtesting 🔄
Pivot Points: Calculate pivot points to determine intraday support and resistance levels. They help traders make decisions on entries, exits, and stops. #PivotPoints ⚖️
Chart Patterns: Familiarize yourself with classic chart patterns like double tops, double bottoms, head and shoulders, and triangles to anticipate future price movements. #ChartPatterns 🔺
Fibonacci Retracements: Apply Fibonacci retracement levels to identify potential support and resistance levels during a market correction. #FibonacciTrading 🌀
Volume Analysis: Analyze trading volume to gauge the strength of price movements. High volume indicates strong conviction, while low volume may signal a lack of interest. #VolumeMatters 🔊
Candlestick Patterns: Study common candlestick patterns like doji, hammer, and engulfing to recognize potential market reversals and continuations. #CandlestickPatterns 🕯️
Moving Averages: Use moving averages (MA) to smooth out price data and identify trends. Popular MAs include the 50-day, 100-day, and 200-day. #MovingAverages 🌊