In july emphasised to be cautious & careful till 1st week of oct..
Lot of positive astro events will trigger starting 4th oct..
Have no answer for questions like when fall will stop?..what low?
My entire emphasis is on time..4th is sunday..anytime after that it may be better.
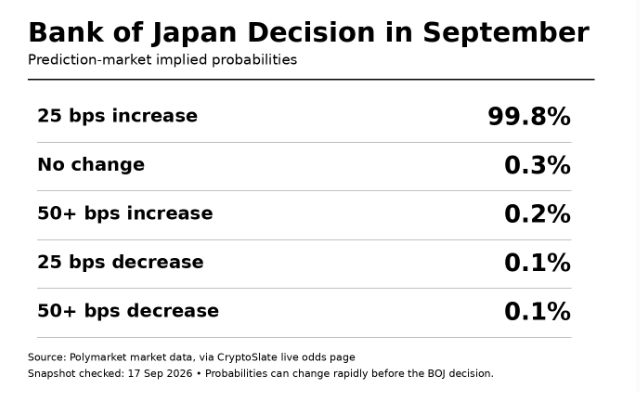
Tomorrow is the most important central-bank decision of the week: BOJ.
Consensus is a 25 bps hike.
But 25 bps changes nothing as FED hiked. The US-Japan rate gap remains huge, the yen-funded carry trade remains attractive, and the basic equation stays intact.
To actually change that equation, the BOJ probably needs 50 bps.
A 50 bps surprise could strengthen the yen sharply, force carry-trade deleveraging and rattle global markets.
If they don’t hike at all( very low chance), the opposite risk appears: yen depreciation accelerates and risk assets could melt up as carry trades get another green light.
This decision is potentially far more important for global liquidity than yesterday’s Fed decision .
Ahead of it, I would keep core investments untouched but avoid carrying unnecessary speculative exposure.
Tomorrow could be extremely volatile.
This is 30-year govt UK gilts chart.
The bond yield fell sharply today as BOE halted the sale of 30-year bond completely over next 6 months as 30 year yield hit highest since 1998.
I am reminded of the quote by a political advisor to president clinton.
"I used to think that if there was reincarnation, I wanted to come back as the President or the Pope or as a .400 baseball hitter. But now I would like to come back as the bond market. You can intimidate everybody.”
so UK will shorten the maturity of gilts because the buyers want more term premium to buy 30 year Gilt at acceptable yield.
this is how LATAM funds itself.... this is template for all developed economies.
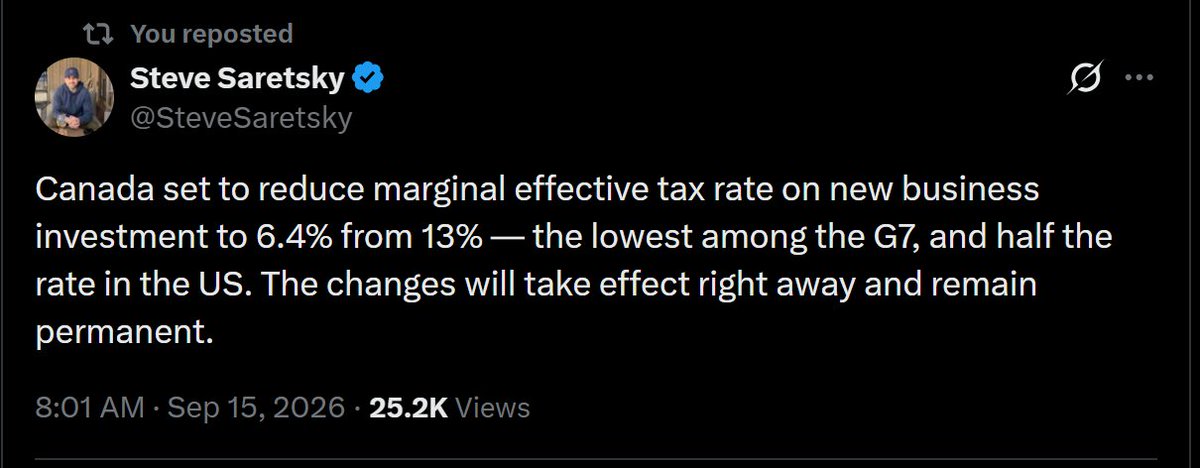
US Federal Reserve Raises It's Rate: Is The Bank Of Canada NEXT?
Will Canadians see higher interest rates?
Kevin Warsh the new Federal Reserve Chairman announced a 25 BPS increase to the Fed Funds Rate yesterday
What will Tiff Macklem do?
It will come down to 2 Dates
2/
What if Fed rate hikes are pushing Treasury yields higher instead of lower?
The table shows the Fed funds rate raised to 3.75–4.00%, yet the entire Treasury curve has moved the wrong way — the 2Y up 127 bps, 10Y up 82 bps, 30Y up 49 bps — while debt-to-GDP climbs from ~122% to ~126% and gold stays above 4,000 since start of the year.
This isn’t normal monetary transmission. It’s the early signature of fiscal dominance, and there’s a striking historical parallel worth considering.
Brazil 2013–2015 — the doom loop playbook:
The Central Bank of Brazil hiked the Selic from 9% to 14.25% one of the steepest tightening cycles in any major economy. The result:
• Inflation still hit 10.5% (fastest since 2002)
• Interest payments exploded from 4.8% to 8.0% of GDP in two years
• The fiscal deficit worsened to 10%+ of GDP — the rate hikes themselves were a primary cause
• The ex-ante real interest rate hit 8.1%, among the highest in the world — yet inflation expectations still worsened
• Brazil’s own central bank admitted that “a consistent and sustainable fiscal policy was necessary for monetary-policy actions to be fully transmitted to prices”
The mechanism was a doom loop: rate hikes → higher government debt service → wider deficits → higher market yields → higher inflation → more pressure to hike.
The ECLAC confirmed fiscal dominance empirically — both fiscal and monetary policy were conducted actively and simultaneously, meaning the central bank was hiking while the fiscal authority was expanding deficits.
Monetary transmission simply broke.
Equities are not afraid of a bond selloff. They are afraid of an UNCONTROLLED bond selloff.
The 10Y can rise to 5% and equities can keep ignoring it as long as the move remains orderly.
But how do you measure when the bond selloff is becoming disorderly?
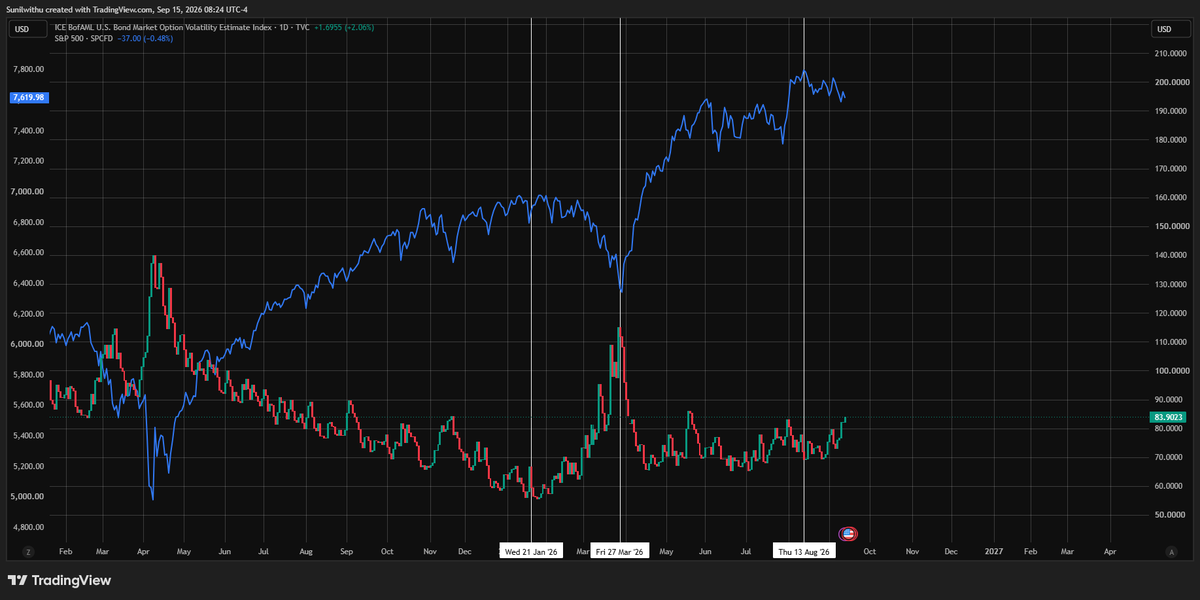
Watch the MOVE Index , basically the VIX of the Treasury market.
MOVE measures implied volatility in U.S. Treasuries.
Last time MOVE exploded higher, equities finally cracked.
Why?
It wasn't simply yields going up.
It was:
Oil ripping higher
→ inflation expectations rising
→ bonds getting dumped
→ Treasury volatility exploding
→ MOVE surging
→ equities correcting.
Now look at MOVE again.
It spent weeks building a base.
And it is starting to threaten another move higher.
This is what I’m watching very closely.
The next catalyst could be a Fed surprise.
It could be another violent move in oil.
Or something else entirely.
But the signal matters more than guessing the catalyst.
10Y yields rising = pressure.
10Y yields rising + MOVE breaking out = the bond market is moving towards uncontrolled selling.
That is when equities should start paying attention.
Watch MOVE.
Some history from 2007-2008 period
- US 10-year Treasury rate (5.11%) and 30-year rate (5.23%) peaked in July 2007.
- US markets (Dow Jones and Nasdaq) peaked 3 months later in October 2007
- that time sub prime and housing market was in bubble zone and no body believed it can burst as they thought it is all secured through real assets. This time, better not say anything.
- Markets worldover corrected sharply and later made a "V" shape recovery within 6-7 months after intervention of the central banks
Question is will we have such central banks intervention available this time, if a similar correction gets repeated?
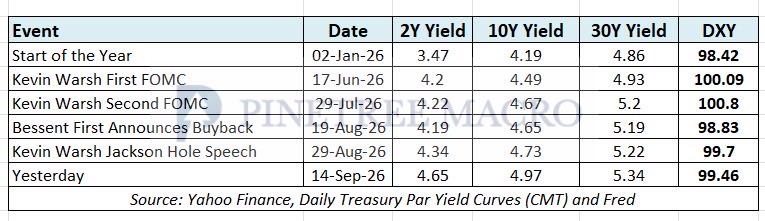
Look at the US yields at start of the year and then look at where they are today?
Rising yields make a currency attractive and a 100 bp rise in short term U.S. yields and 50 BP in medium to long term yields would certainly ( anytime before Covid) would have led to a sharp spike in DXY.
Now look at DXY… if rising bond yields and rising Oil do not lead to rising DXY then when will Dollar index rise?
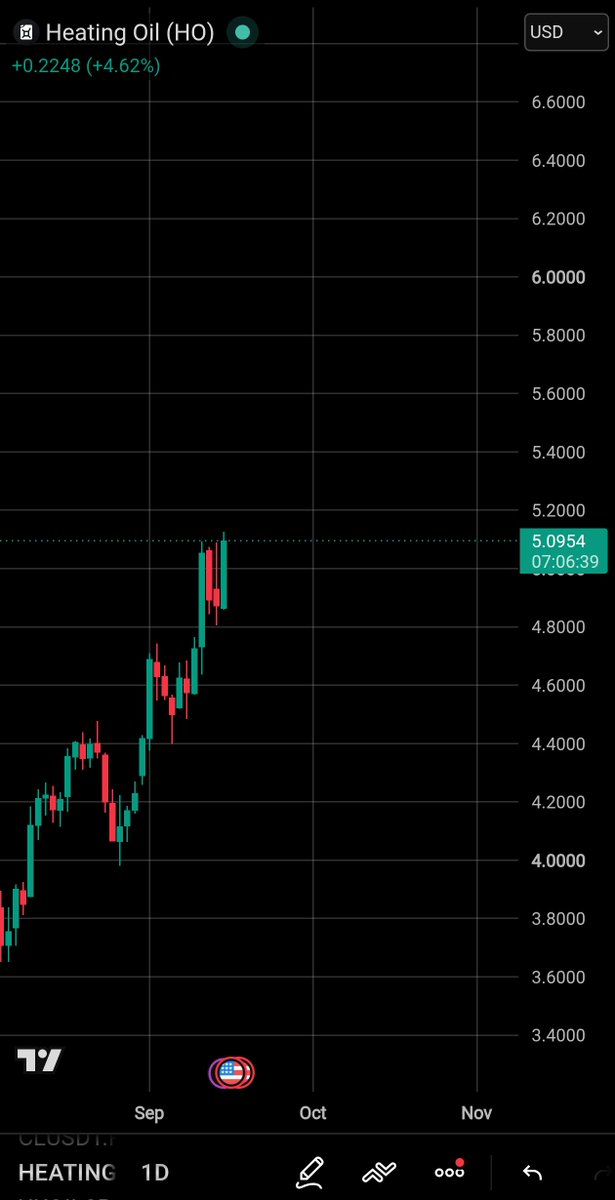
Diesel is up 4.5% and just made a fresh high, even after Trump announced an energy-war truce between Russia and Ukraine.
Diesel is the real squeeze on the fuel spender.
Trucks, agriculture, industry, freight — this is where higher energy prices directly hit the economy.
If the market genuinely believed the announcement would materially improve energy supply, refined products should be cooling.
Instead, diesel is making new highs.
The physical market is not trading the posts. It is trading the barrels.
Right now, it looks like the market is simply not in the mood to believe Trump headlines anymore.
If you're invested in big, low grade open pit mines, take note. Higher diesel kills mine economics.
Worst case scenario, companies suspend operations because they can't procure diesel.
Knowing what miners you own is more important than ever. A rising tide won't lift all boats.
Canada's Inflation Report Today: NOT Bad News What Did We Learn?
- It's a lagging report so the recent disastrous rise in Oil prices isn't in it
- It does prove that aspects of CPI were slightly cooling prior to the recent Energy surge
- Good News for Variable Rates
2/
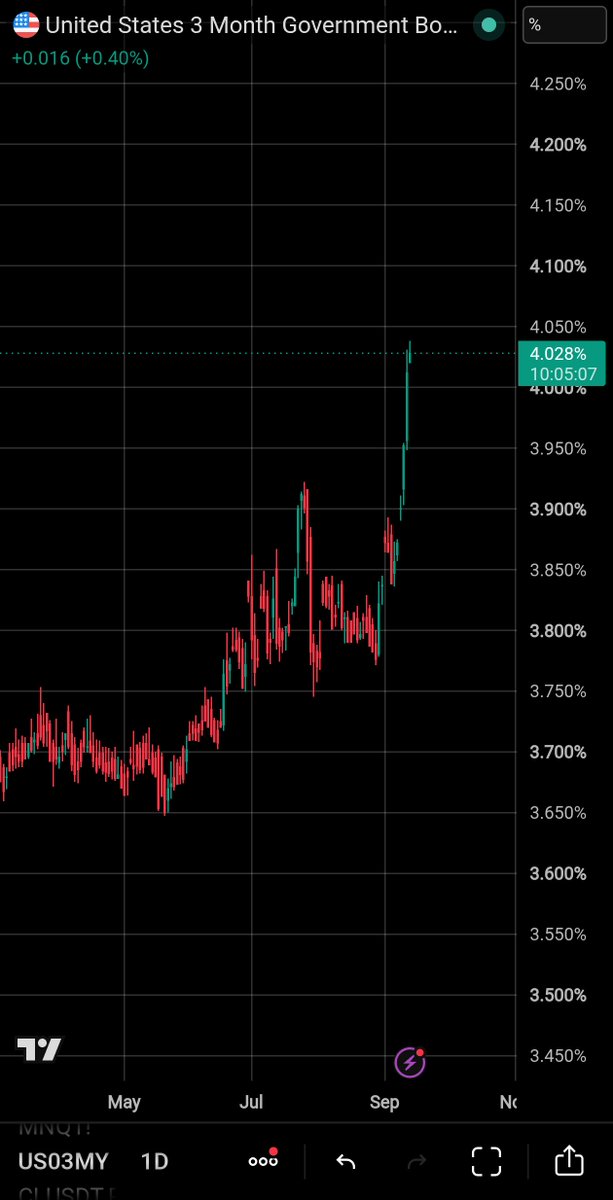
U.S. 3-month bill yields are surging ahead of the FOMC, now back above 4%.
The market increasingly looks like it is preparing for a 25 bps Fed hike.
Japan is also expected to raise rates by 25 bps this week.
That creates an interesting problem.
If:
Fed +25 bps
BOJ +25 bps
then the U.S.–Japan rate differential barely changes.
From the carry perspective, the game moves nowhere.
For a meaningful change in the yen-funded carry structure, one central bank eventually has to diverge from the other.
And if Japan fails to do that, it cannot keep selling Treasuries forever just to buy time.
Eventually, it may be left with one option:
panic rate hikes.
We are moving from a world defined by panic rate cuts to one where panic rate hikes could become the new policy response.
How the end of the low-interest-rate era will hit real estate and land:
The biggest change in that the low-interest-rate economy is over, and I don’t see it coming back anytime soon.
That changes how every type of property should be valued.
I divide real estate into three buckets.
1. Duration assets
Land whose value depends mainly on what someone will pay for it 15–30 years from now.
Commercial and residential land on city outskirts are the clearest examples.
These were major beneficiaries of cheap money and falling bond yields.
That tailwind is gone.
With structurally higher government bond yields, future value gets discounted harder.
I expect nominal appreciation in these assets to slow significantly compared with the post-Covid period.
2. Cash-flow real estate
Shops, rental properties and residential houses.
They generate income today, so they are less sensitive than pure duration land.
They should hold up better.
But higher discount rates, inflation and financing costs will still slow valuation growth.
3. Agricultural land
This is where I am more constructive.
Good agricultural land generates cash flow and produces something whose price rises with inflation.
I think of productive farmland as a soft-commodity miner.
In the environment we are entering, I expect it to do better than pure duration land.
But selection matters.
Water availability should be reliable and not heavily dependent on energy.
The post-Covid real estate boom was built on cheap money and falling discount rates.
That world is over.
The next cycle will reward cash flow, productivity and inflation linkage.
They are repeating 1973 again.
Back then, inflation was already rising and food was getting expensive.
Then war hit the Middle East.
The U.S. backed Israel.
Arab producers retaliated with an oil embargo.
Crude went from roughly $3 to nearly $12.
The shock spread through diesel, fertilizer, transport and food.
Inflation became embedded.
Then another oil shock hit in 1979.
It eventually took brutal interest rates and a deep recession to break the cycle.
Today, another Middle East energy shock(very similar to 1973) is hitting a system with far more debt, larger deficits and much more financial leverage.
1973 hit a fragile monetary system.
This one is hitting a fragile monetary and debt system.
That is what makes today more dangerous.
Many people assume things settle once the war is declared over.
They don’t.
Read the 1973 playbook properly.
The war can end quickly.
The damage to energy, inflation, supply chains, wages and confidence takes years to repair.
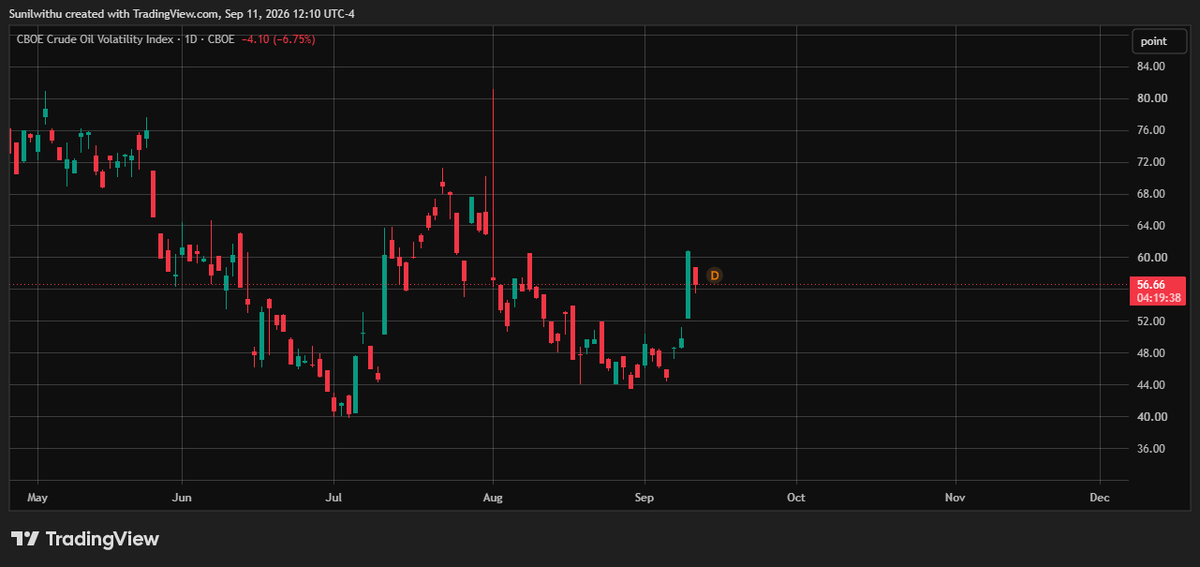
Watch Oil volatility if you want to track how the short squeeze is progressing.
This applies not just to Oil, but to almost any commodity.
When price rises together with volatility, shorts and call writers are getting trapped. They are forced to cover and hedge, which creates mechanical buying in futures and pushes the move even harder.
We saw the same thing in Silver.
The next thing to watch is the volatility chart itself.
When you start seeing huge green days in VOL while price is exploding higher, the squeeze is entering its late stage and the move is getting closer to a climax.
Price tells you the direction.
Volatility tells you how stressed the positioning has become.