All you need is a few big trades. Better to save your dry powder for high conviction. Most ppl burn up all their dry powder trading dog shit daily just bc they are bored. Learn to sit on your hands and wait for the big trade imho.
Anthropic Academy just dropped FREE AI courses that could replace a $10,000 degree.
$0. No catch. No gatekeeping.
Here are 6 AI courses that could separate you from everyone else in 2026:
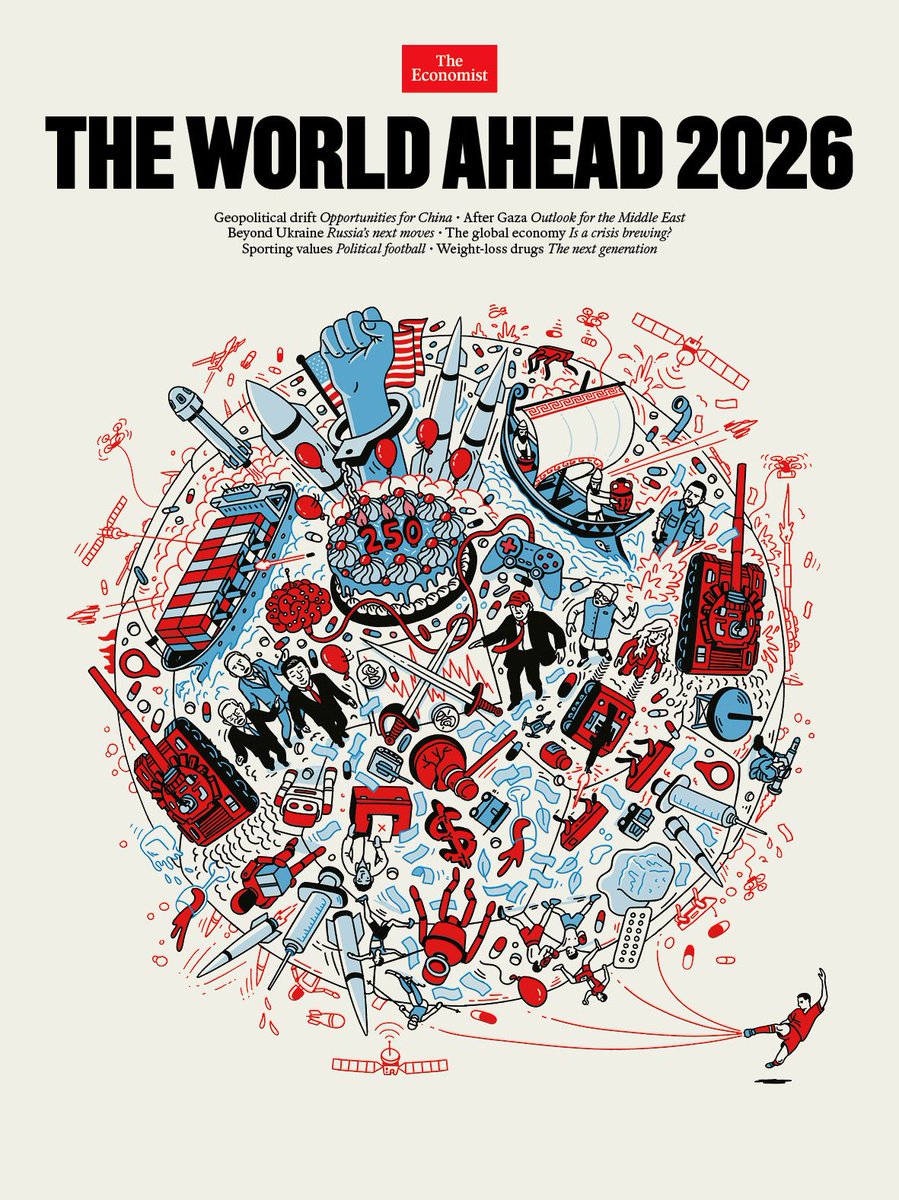
👁️ The World Ahead 2026 👁️
I want to offer you my personal intepretation of the last cover of "The Economist" which has raised a lot of questions, so I will try to do my best in order to decipher it with an eye on financial markets. (long post but well worth it in my opinion)
- Main thesis -
The central thesis of my interpretation is that the cover of The World Ahead 2026 depicts a world being structured to function under permanent instability.
War, economic stress, technological disruption, health intervention, cultural conflict..everything is part of an interdependent mechanism of a single system where instability is the operating condition through which power is exercised and maintained.
This is why the illustration is so crowded.
If you think about, nothing exists on isolation, right?
♻️Military conflict bleeds into economics, economics into health, health into technology, technology into culture, and culture back into politics.
The absence of clear boundaries is not a "mistake of the author" but its a message: separation itself has ended.
The thesis, therefore, is not that chaos is imminent, but that chaos has been domesticated making it more predictable, governable, and in some cases (most of them) economically productive.
Just look around you..the system adapts populations to volatility through continuous intervention: policy, media, medicine, and technology.
"What?"
Well:
- Conflicts are contained rather than concluded
- Economic stress is offset rather than eliminated
- Social tension is redirected rather than reconciled
What we can extract, therefore?
That seen through this lens, the cover functions as a declaration of a "new normal", communicating to its intended audience that the future will not be defined by grand solutions but by adjustments and control within limits.
The task of power in 2026 is not to restore order, but to operate effectively inside disorder so everything that appears on the cover, from missiles to medicines, from financial symbols to cultural icons serves this single idea, in my opinion.
- Element by element -
1. Globe as a soccer ball ⚽️
As we can see the world is drawn like a soccer ball and this is a clear metaphor tied to the 2026 FIFA World Cup that will be co‑hosted by the U.S., Canada, and Mexico making sport a global stage for "soft power" and identity.
Now what I'm thinking is that the iconic figure of Ronaldo kicking the ball may be interpreted less as an athlete and more as an emblem of institutional power, demonstrating how deliberate interventions can set a globally interconnected system in motion, exactly as he does with the ball, bringing volatility on the table.
Start date: 11th June 2026
End date: 19th July 2026
I would keep an eye on the start.
2. U.S. flag behind a large birthday cake 🇺🇸
This is a clean reference to the U.S. 250th anniversary in 2026 that should put America at the heart of global history.
However in here we have an important factor to pay attention at, which is the juxtaposition of celebration and crisis as the cake is surrounded by "doom" elements like missiles, war ships etc meaning, in my humble opinion, that the country may not be immune to global shocks.
3. Raised fist + broken gavel ✊
With the U.S. flag slightly behind, this likely means societal tension, possibly unrest and friction between authority and civil populations (BLV docet) where the cracked gavel denotes weakened institutions.
As an implication, political legitimacy and justice systems will be under strain with implications for policy consistency and economic confidence.
4. Missiles across the sky + tanks on globe 🪖
These are straightforward references to military conflict and armament escalation both ongoing and potentially emerging.
Tanks and missiles together imply multi‑domain warfare (land and strategic weapons) showing conflict as a pervasive backdrop of world affairs, not isolated crises. (remember what we were saying in the beginning?)
Conflict becomes background noise rather than a singular shock.
From an investment standpoint, this favors sectors tied to defense, energy security, logistics, and commodities.
5. Red/blue code 🔴📘
Something that people may not notice is the intended colors to represent the drawing.
Red is a color used to express danger and tension and in this context could be interpreted as a conflicts between countries and therefore, strong volatility.
Blue instead, flags authority or governance and based on my belief, it can signal the forced introduction of a new technology to gain control. (CBCDs?)
Essentially, competing forces, so think of it like a chessboard where red pieces create pressure or threats, and blue pieces try to contain or manage that pressure.
6. Syringes/pills 💉💊
In here we have oversyzed syringes and scattered pills dispersed around so this should represent:
- The rise of biotech, drugs, defensive stocks
- Potential pandemics/flu
- Potential vaccination campaigns, innovations etc
Medicine/healthcare should be a primary narrative.
7. Brain plugged into a gaming controller 🧠🎮
To me this is a clear reference to AI (human integration) and possible digital control.
It shows that attention, perception, and decision-making are increasingly engineered within interconnected systems so control over information and behavior becomes a core domain of power, with, as you can imagine, direct implications for economics, governance, and social stability.
Deep fakes? Algos driving your interest?
It may be just the beginning.
It may be not stupid to consider as investment chips, cloud, cybersecurity, and platform providers..
8. Ancient style boat⛵️
A boat is by de-facto a symbol of movement, transition and exploration of the uncertainty.
Because the boat is anachronistic compared with the other elements, it likely isn’t meant to point to a specific 2026 event, but rather to hint that long‑standing historical currents, traditions, or ideas continue to influence modern dynamics.
If we assume that 2026 will be a year of changes and especially in a context of technological disruption, geopolitical tension, and volatility well..we have a +1.
9. Melting ice cubes 🧊
On the external part of the globe we can find melting ice cubes which are an ideological representation of climate change and overall enviornmental instability.
Alone is a reason to pay attention because climate change is widely recognized as a systemic risk to financial markets (supply chain, harvests, production costs) that may affect asset values across specific sectors.
It may also signal another reason to pay attention to "new solutions" in the agricultural landscape.
If this is the case, I would look into alternative agriculture, water, energy infrastructure, and climate adaptation..
10. Geopolitical tensions & financial markets ⚔️
The thing that jumps out immediately below the cake is a chart with swords crossing each others, likely mirroring the trade war between China and U.S.
The chart clearly appears chaotic, with peaks and troughs emphasized, creating a sense of volatility and tension..but the predominant color is red, and this alone is a powerful sign.
Red implies risk, pressure, or threat and it can be associated with loss, drawdowns and negative sentiment, aka economic impact.
11. 3 extras I noticed 🛰️ 💸🤖
- Satellites likely meaning global observation, surveillance, connectivity and space-defense
- Money printing that can flash bank interventions and stimulus as the dollar is "cracked"/broken currency indicating structural fragility in global currencies and overall economy
- Robots/dogs/drones that may be interpreted as automation and replacement of humans in the production chain/companies + further adoption of robots in our daily lives
--------------------------------------------------------
👁️Bottom line and considerations:
In reality, the cover of "The Economist" isn't an overall mistery to me and this simply because I had the perception of a potential very turbulent year explained here https://t.co/Och3W6SScg so it goes hand in hand with the thesis.
However, despite my expectations for an overall complicated year, I believe that at least the Q1 will be positive and this is not based on some details in the cover but is explained in my charts https://t.co/30DQbmSsxa and their liquidity dynamics, so before a potential collapse I see us performing well.
"Any other indication?"
Something that may be added is BTC seasonality/cycle.
If we consider:
- Top2top -> 1490 days (first cycle)
- Bottom2bottom -> 1430 days (first cycle)
- Top2top -> 1431 days (second cycle)
- Bottom2bottom -> 1431 days (second cycle)
Then, if this is the top (we may even get a new high but this doesn't change the overall idea) then our bottom should be in late 2026 and considering everything we stated above, well..we have a good recipe.
This post will updated step by step as we transition into the next year looking quarter by quarter to see what we have and how things are evolving.
If you like this post and find value in it, the like and repost buttons are just a few centimeters below.
𝗙𝗢𝗫𝗜𝗔𝗡 𝗗𝗘𝗖𝗘𝗠𝗕𝗘𝗥 𝗥𝗘𝗦𝗨𝗟𝗧𝗦 📊
+83% Winrate and +940% Gains
The last month of 2025 closed like this on Foxian, the market was very Choppy, but Foxian analysts were able to record good statistics🔥
Let's go for a year full of Wins and green pnls, we promise 2026 will be even better on Foxian
There is a guy on Twitter with over 500K followers, posting screenshots of his $70M portfolio. He makes money off a $500 subscription he has on Telegram. I've seen many of you guys talk about his predictions. Maybe you joined his group. Perhaps you are considering it now. What you haven't seen is the 10,000+ people who followed him and have blown up their portfolios. They aren't posting about their experience. They've deleted their accounts. They've gone back to work and are no longer talking about trading. They are invisible. This is survivorship bias, and it may be the single most expensive cognitive mistake in trading that you will ever make.
I'll give you a bit of a reality check on this topic. Researchers at the University of Sao Paulo did an interesting research that no one else had ever done (at least not in Brazil). From 2013 - 2015, they tracked each person who began day trading Brazilian equity futures. They tracked all of them, not a small sample size. The Brazilian futures market is the third largest futures market in the world by trading volume, so this wasn't some backwater exchange. During this time, they watched 19,646 people who made their first day trade. The results were awful. 97% of people who continued trading for more than 300 days lost money. Not broke even, they just lost money. After a year of trading every day, 3% of people made money. Only 1.1% of those people earned more than the Brazilian minimum wage ($16/day), and only 0.4% earned more than the starting salary of a bank teller ($54/day). The highest performing trader in the study earned an average of $310/day with a standard deviation of $2,560. On any given day, he could be up $3,000 or down $2,000. That was the top performer. The researchers called their paper “Day Trading for a Living?” and the authors concluded that it is very difficult for anyone to day trade for a living. However, the most interesting finding was that they found no evidence of improvement over time. None. The learning curve that every trading book says exists does not exist in the data. People who traded for 300 days were just as bad as people who traded for 50 days.
If 97% of day traders lose money, then why do all of the day traders on social media appear to be profitable? Because the losers stop trading. They delete their accounts and remain silent. The few who remain continue to post their successes and continue to sell courses and gain followers. That is literally how survivorship bias works. You only see the planes that returned from the bombing run. You do not see the ones that were shot down.
During World War II, the U.S. Air Force was having problems with its bombers being shot down over Europe. The Air Force wanted to add armor to the planes to protect them from enemy fire; however, armor adds weight, and adding too much weight would cause the planes to become unable to fly. Therefore, the Air Force needed to determine where to place the armor. They hired a statistician named Abraham Wald to analyze the bullet hole patterns of planes returning from missions. The data showed bullet holes clustered in the wings, fuselage, and tail of the planes. There were very few bullet holes around the engines. The Air Force decided that they should add armor to the wings, fuselage, and tail of the planes. But Wald disagreed. He said that the Air Force should add armor to the engines of the planes. Why? Because the planes that Wald analyzed were the ones that made it back. The bullet holes in the wings and tail of the planes showed areas of the plane that could take real damage and still allow the plane to return safely to base. The reason there were no bullet holes around the engines was not because the engines were not taking damage. It was because the planes that were damaged enough to get bullet holes around the engines never really returned. The Air Force only saw the planes that made it back. But the real information was in the planes that were shot down and did not return.
You may think that survivorship bias is only a day trading problem. Actually, it is not. Survivorship bias exists in every area of investing. In 2011, Vanguard released a study on mutual funds that covered the period 1997 to 2011. The researchers looked at the performance of the mutual funds over this 15 year period. During this time, 46% of the mutual funds either closed or were merged into another fund. Almost half. Gone. And here is the interesting part. Most of the funds that were closed or merged were the worst performers. 87% of the funds that were merged into other funds were underperforming before they were merged. Fund companies were not closing their high performing funds obviously. They were closing their low performing funds. Why does this matter? Because when you review the performance of mutual funds, you are only reviewing the performance of the funds that are still available. The poor performers were closed, merged, or renamed, and are no longer listed as separate entities. And as a result, the average performance of mutual funds is naturally skewed upward after you eliminate the poor performers. John Bogle, the founder of Vanguard, said it clearly. “What we think of as the typical mutual fund's returns are just grossly overstated.”
Another study, conducted by Savant Capital Management, reviewed the performance of Morningstar rated mutual funds from 1995- 2004. The researchers included both the surviving funds and the closed funds in their analysis. They found that if they only included the surviving funds in the Large Blend category, the average annual returns were 10.8%. If they also included the closed funds, the average annual returns fell to 8.9%. That is almost a 2 percentage point difference. Over 20 years, compounded, that is the difference between doubling your money 4 times vs 3.5 times.
Research on the performance of individual traders pretty much gives the same results. Two finance professors, Brad Barber and Terrance Odean, obtained trading records from a major online discount brokerage firm. The records were for 66,465 households and contained 6 years of trading data from 1991 - 1996. They found that the average household was trading 75% of its portfolio annually. That is a lot of trading. The market returned 17.9% per year during this time. The average household earned 16.4% per year, a loss of 1.5 percentage points, mainly due to the transaction costs. However, the most active traders, the top 20% of traders by trading frequency, earned 11.4% per year, a loss of 6.5 percentage points. To show you the impact of excessive trading, let's assume you start with $100,000 and hold the market for 20 years at 17.9% of returns. At the end of the 20 years, you will have approximately $2,800,000. However, if you actively traded and earned 11.4%, you would have approximately $870,000. Over 20 years, the active traders lost $1,900,000, and that is simply the cost of overconfidence.
Barber and Odean also found that the more successful the traders became in the short term, the more likely they were to continue trading excessively. Success gives you overconfidence, and overconfidence makes you trade more, which eventually leads to poor performance. The cycle just continues to repeat itself.
I found a similar study conducted in Taiwan from 1992 – 2006 where researchers used complete trading data for the entire stock market for 15 years. Less than 1% of day traders were able to produce predictable and reliable positive returns. Though the top 500 day traders in Taiwan were able to get good returns, most of the day traders simply just lost money while trading. The researchers also discovered that if you only studied the top 500 traders, you would conclude that day trading is extremely profitable. You would attempt to reverse engineer the strategies of successful traders. However, you would almost certainly fail, because you would only be analyzing the survivors. The Financial Industry Regulatory Authority reported that in 2020, 72% of day traders lost money during the year. Additionally, 40% of day traders quit trading within the first month. Only 13% of day traders remained active in trading for more than 3 years. But despite the high failure rates, the industry continues to grow. More retail traders than ever before are trading. The record number of new exchange accounts were opened in 2020 and 2021.
Now, let's talk about the money flow in the trading education industry. A trading guru with 100,000 followers creates a course worth $500. If 2% of followers purchase the course, that is 2,000 sales and $1,000,000 in revenue. Does this guru need to be a profitable trader? No, he needs to be a skilled marketer. He needs to provide screenshots of winning trades. He needs to create credibility for himself through content. This is how the scam works. You trade on a demo account or a small live account. You take hundreds of trades. Some win big, and some lose big. You show the wins and ignore the losses. Or, you do something even easier. You join 10 signal groups and start taking the calls. When one group gives a 500% ROE trade, you show it to your audience and say it was your call. Since no one can verify where the signal is from, you can just lie. Or, even better, you use Photoshop. You show fake account balances, and it takes less than 30 seconds anyway if you know what you are doing. The Securities Exchange Commission investigated trading education companies in the late 1990s. Their report found that the promotional claims of 80-85% customer profitability were not substantiated by the firms' own data. The overwhelming majority of customers lost money, usually quickly and in large sums. That was 25 years ago. The advertising techniques have simply gotten better over the years, and the real alpha in this business model is in the wallets of retail traders.
If you are someone who actively trades, I want you to do something. I want you to think of every trading education product you have purchased. Every course. Every Twitter guru. Every YouTube video. Every strategy you have learned from someone else. I want you to ask yourself. Did any of these people show you their verified, confirmed track records? Not a screenshot. Not a demo account. A verifiable statement or data from an independent exchange or broker? I am willing to bet that the answer is no. You have been learning from the survivors without any ability to verify whether they are truly the survivors. The profitable trader you are attempting to copy may just be lucky. They may currently be in the middle of a hot streak that will end next month. They may be fabricating everything. You have no way to find that out. Even if they are making legitimate profits, their strategy may not be transferable. It may be dependent on the current state of the market. It may require a level of capital that you do not have. It may require a psychological makeup that you lack. There are so many variables involved here.
The reality is that, for an average retail trader, the most common outcome (i.e., median) is to lose money. In other words, you are much more likely to lose money than win money. And this isn't my opinion - this is the consensus from almost every study ever conducted on this topic. And those few individuals that do find ways to win money on a regular basis have developed some distinct habits over time; being able to identify and trade with some very unique edge, being obsessed about managing risk, continuing to trade until they are profitable, and treating trading like a serious business, rather than entertainment. Even among those people who meet the above criteria, the profit margins are typically extremely low. It is a fantasy for nearly everyone to expect to achieve consistent yearly profits of 100%. Many of the world's top professional traders working at hedge fund funds will typically settle for a profit margin of around 15-20% per year, with what many would consider reasonable levels of risk. So, why do you think you'll be able to achieve the same results on your phone, and that too in a month?
That does not mean that you should not trade. I trade. What I am saying is that you should trade with your eyes wide open. Treat every trading educator as guilty until proven otherwise. Require proof of verified track records from educators. If educators will not provide that proof, you should walk away. Study the failures as well as the successes. Learn about how other traders blew up. Learn about how other hedge funds have blown up. Learn why these failures happened and why they were successful in the first place. Be honest with yourself regarding your performance. Keep a record of every trade that you take. Calculate your actual returns using all costs. Compare your performance to a simple benchmark like SPY. If your performance is worse than that of the benchmark, you have a problem. Trade in position sizes that allow you to survive for a full year even if you continue to be wrong. That’s one of the reasons that so many new traders blow up when they start trading - they bet too big too quickly. Also, keep in mind that if you continue to lose money consistently, the right thing to do is not to increase your aggressiveness. The right thing to do is to pull back and find what you’re doing wrong.
Survivorship bias is not only a statistical issue but also a psychological issue. Most of us want to believe that we can be successful. We want to believe that the people who are winning know something that we can learn. We want to believe that there exists a shortcut. There are thousands of people willing to sell you that illusion. They’ll show you the pictures. They’ll tell you the stories. They’ll make it appear to be within reach. They will not let you see those shattered dreams. They will not tell you about the 97% that have attempted to make it and have failed. They will not let you see the majority of people who have given up everything, playing his game. So, next time you are fascinated by a trader flexing their profits on social media, keep Abraham Wald and his bullet holes in mind. The planes that were shot down and returned to base aren’t the only part of the story. The real story is of planes that never came back.
THE WAIT IS OVER, MAIN BLACK FRIDAY'S HUGE DISCOUNTS HAVE STARTED @foxianorg
🔥 45% DISCOUNT ON ALL PREMIUM PACKAGES
MONTHLY: $̶6̶0̶ : $32
QUARTERLY: $̶1̶8̶0̶ : $99
YEARLY: $̶7̶2̶0̶ : $396
LIFETIME: $̶2̶0̶0̶0̶ : $1189
📴 35% on Lifetime Mentorship:
$̶1̶0̶0̶0̶ : $650
🔴You can purchase and reserve them if you don't want to use them now or if you already have a subscription🔴
You can easily purchase these packages from the site with a card or crypto💳
Hurry up, this is the biggest discount of the year and it may not happen again, spots are limited
To purchase these packages from the site⬇️
🔗 https://t.co/OEZcWLtfed
(Click on the website link above 👆 and find the subscription packages on website)
Gm
So yeah last week was rough for almost everyone in the crypto markets
But it’s time to start fresh - couple things you can do
1. Make a new account on an exchange. No old PNL ATH glaring back at you, no equity curve, a fresh stat
2. Make a new trading view watchlist. Filled with tickers that bounced back the hardest after the crash and ones that hardly budged during it
3. Clean up your workspace, whether that be your physical desk or your PC from clutter.
Trust me, I’ve been where a lot of you are. The road back up isn’t easy, but it’s within your reach and it’s definitely attainable.