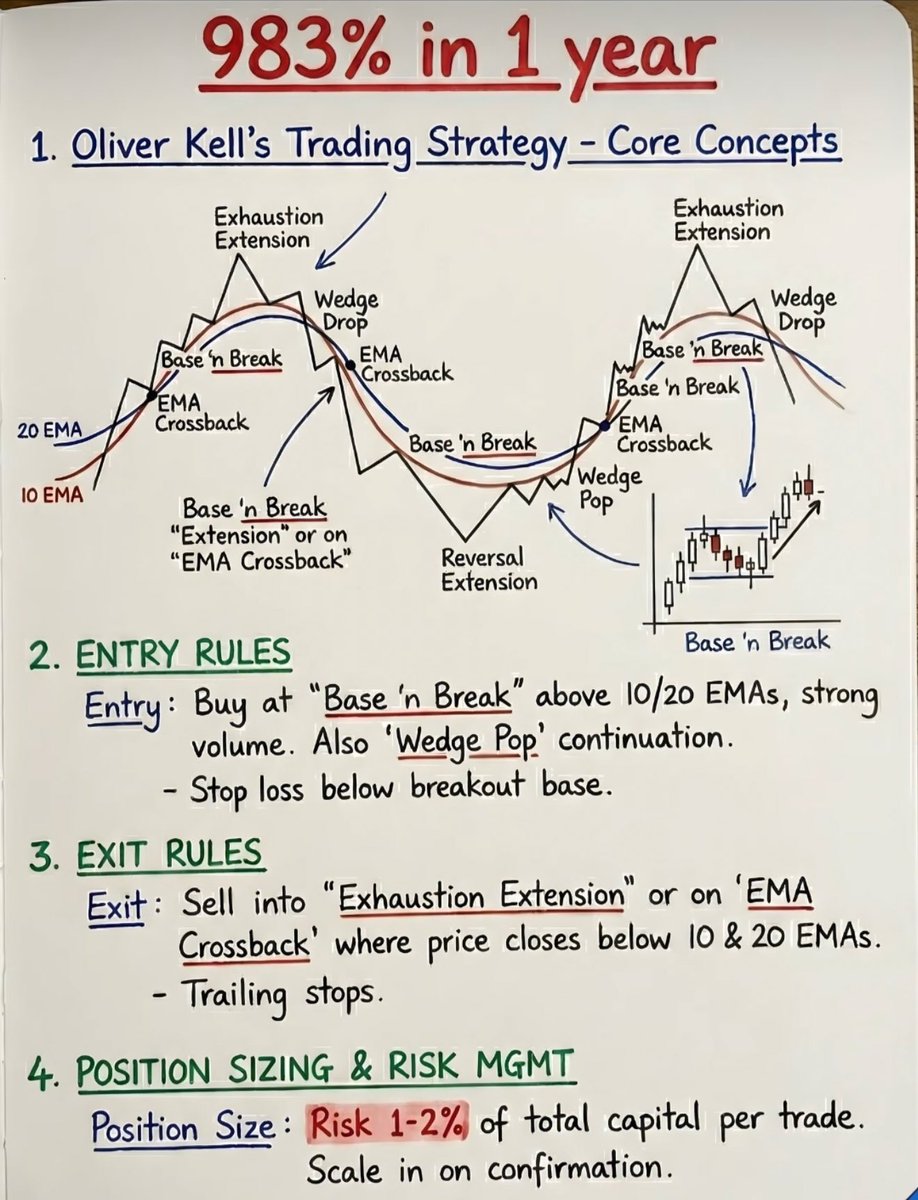
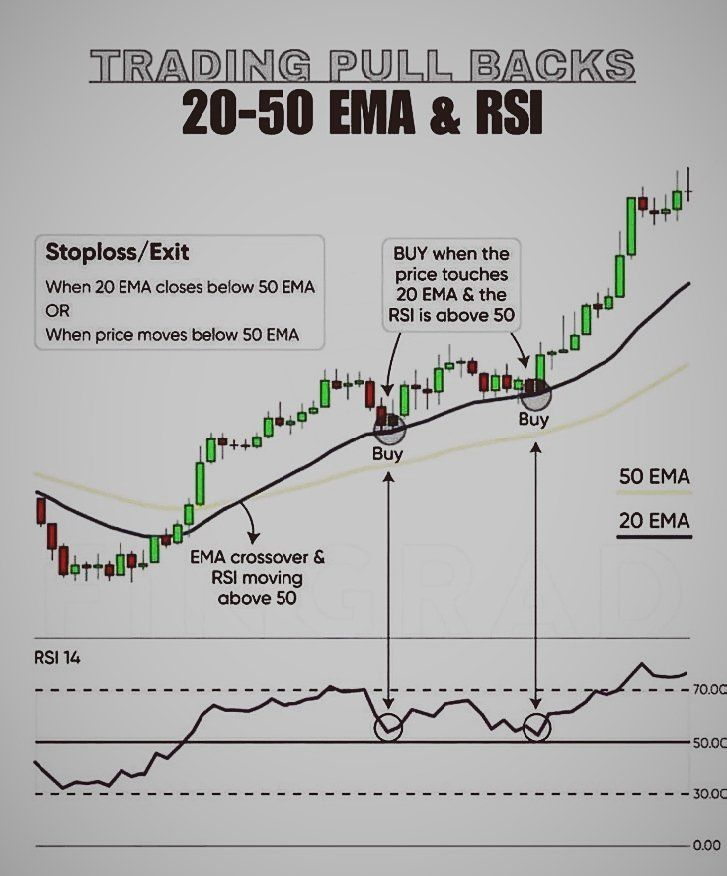
Entry (Buy) Rules:
Wait for the 20 EMA to cross above the 50 EMA.
Ensure RSI (14) is above 50.
Buy when the price touches the 20 EMA and RSI is still above 50.
Exit (Stoploss) Rules:
Exit if the 20 EMA crosses below the 50 EMA, or
If the price drops below the 50 EMA.
This strategy helps traders catch pullbacks in an uptrend with confirmation from the RSI
#trading
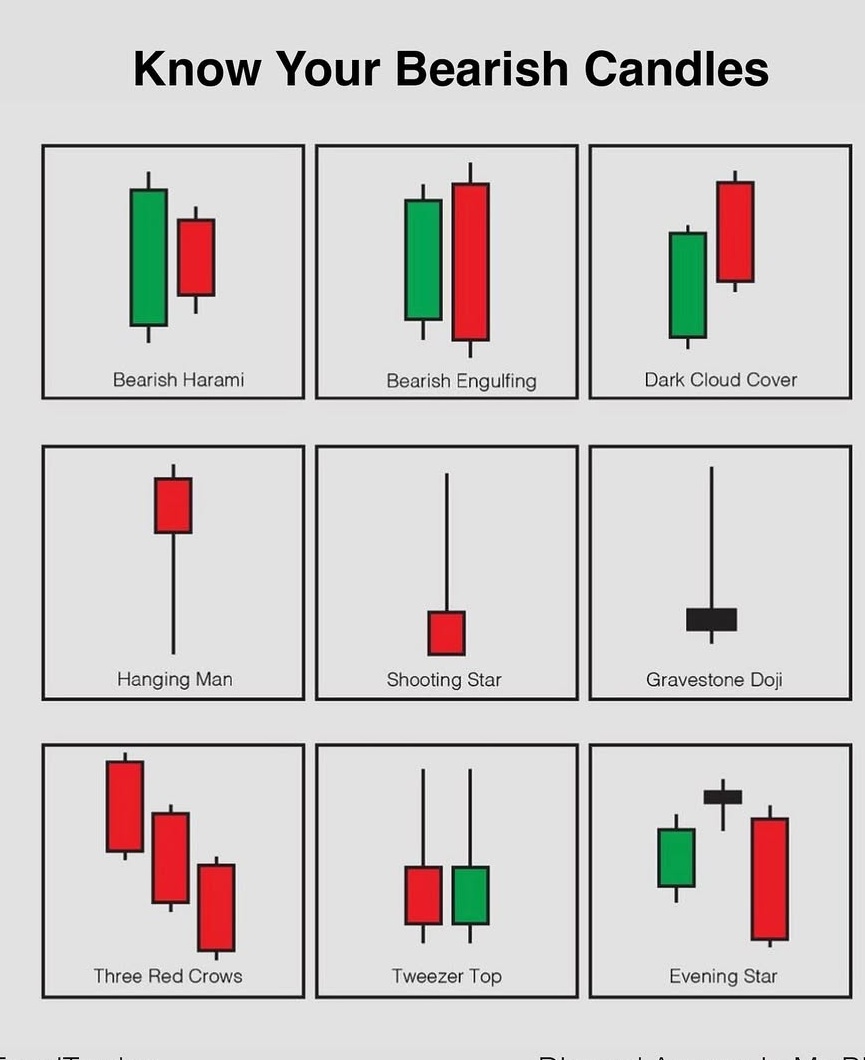
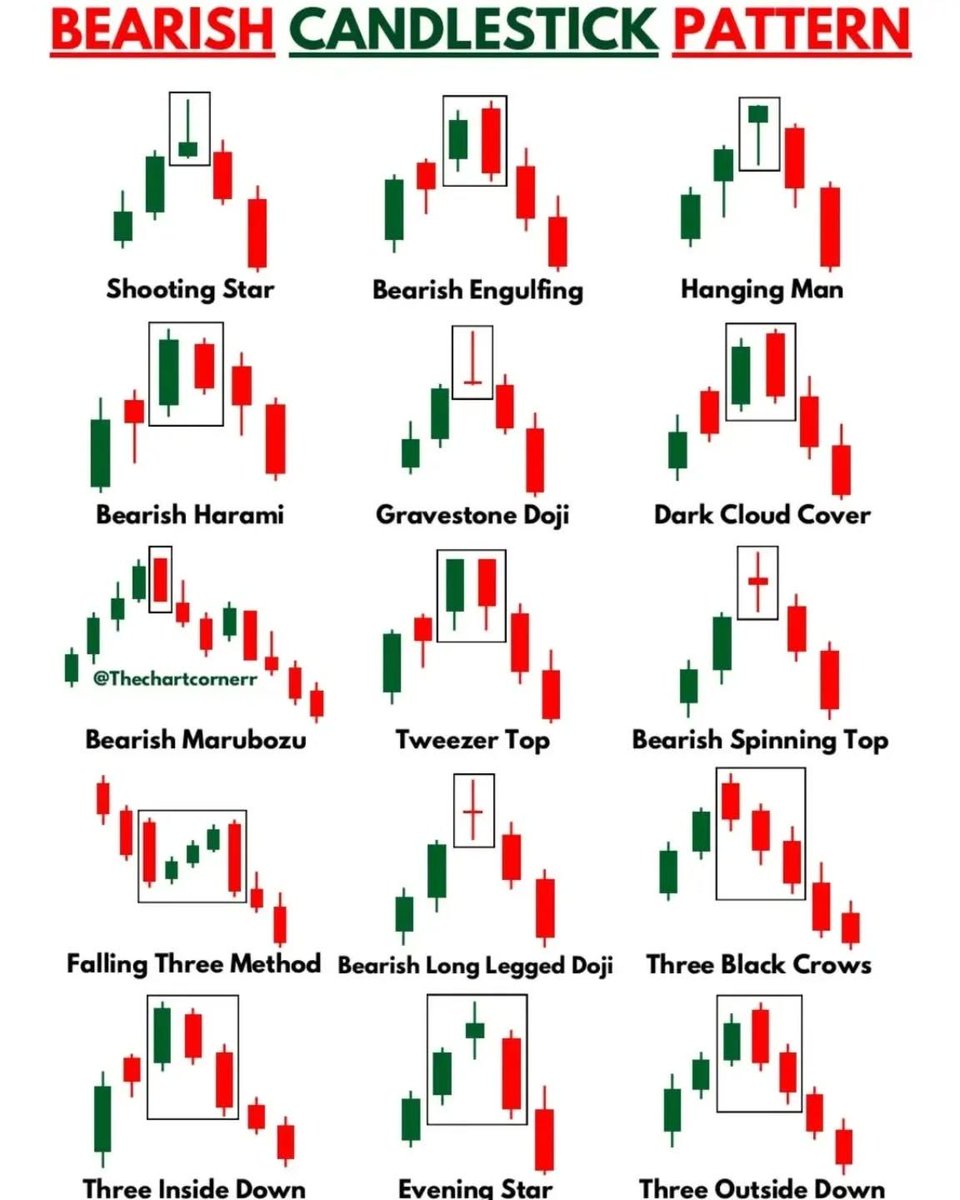
"Master these Bearish Candlestick Patterns 📉💡 and protect your trades like a pro! 💪
Like ❤️ & Repost 🔄 to spread learning with all…
#StockMarket#CandlestickPatterns#TradingTips
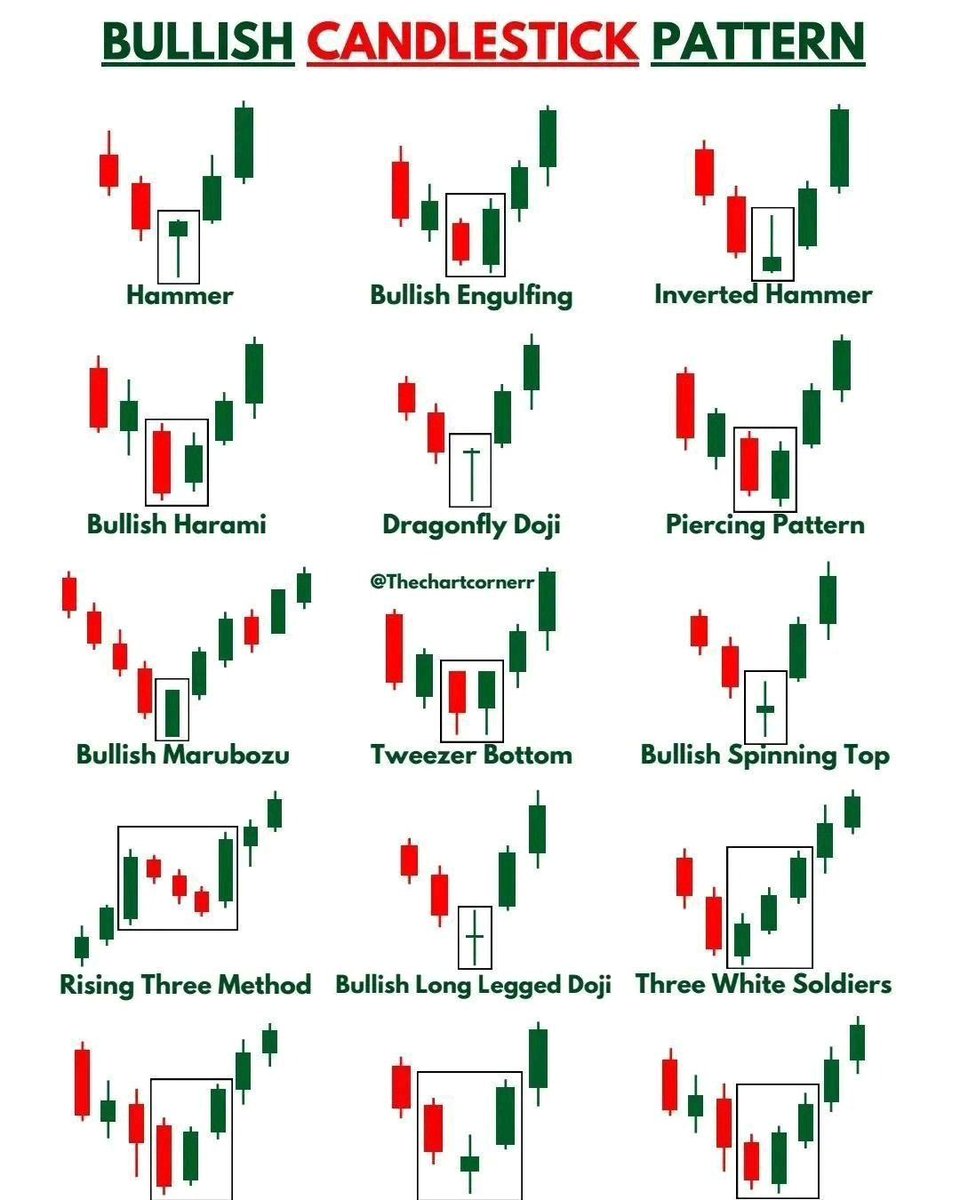
Master these Bullish Candlestick Pattern 📈💡 and take your trading to the next level! 💪
Like ❤️ & Repost 🔄 to spread learning with all ….
#StockMarket#CandlestickPatterns#TradingTips
Moving Average Road Map Trick:
✓5 EMA--Strong Momentum
✓ 10 EMA--Short term trend
✓20 EMA--Pullback support
✓50 SMA--Uptrend defense line
✓100 SMA--Big price dip
✓200 SMA--Bulls last stand in an Uptrend, bears last standing downtrend.
✓250 SMA--Value Zone
Luck doesn't exist in short term unless longer enough 💕
PRACTICE OVER & OVER AGAIN.
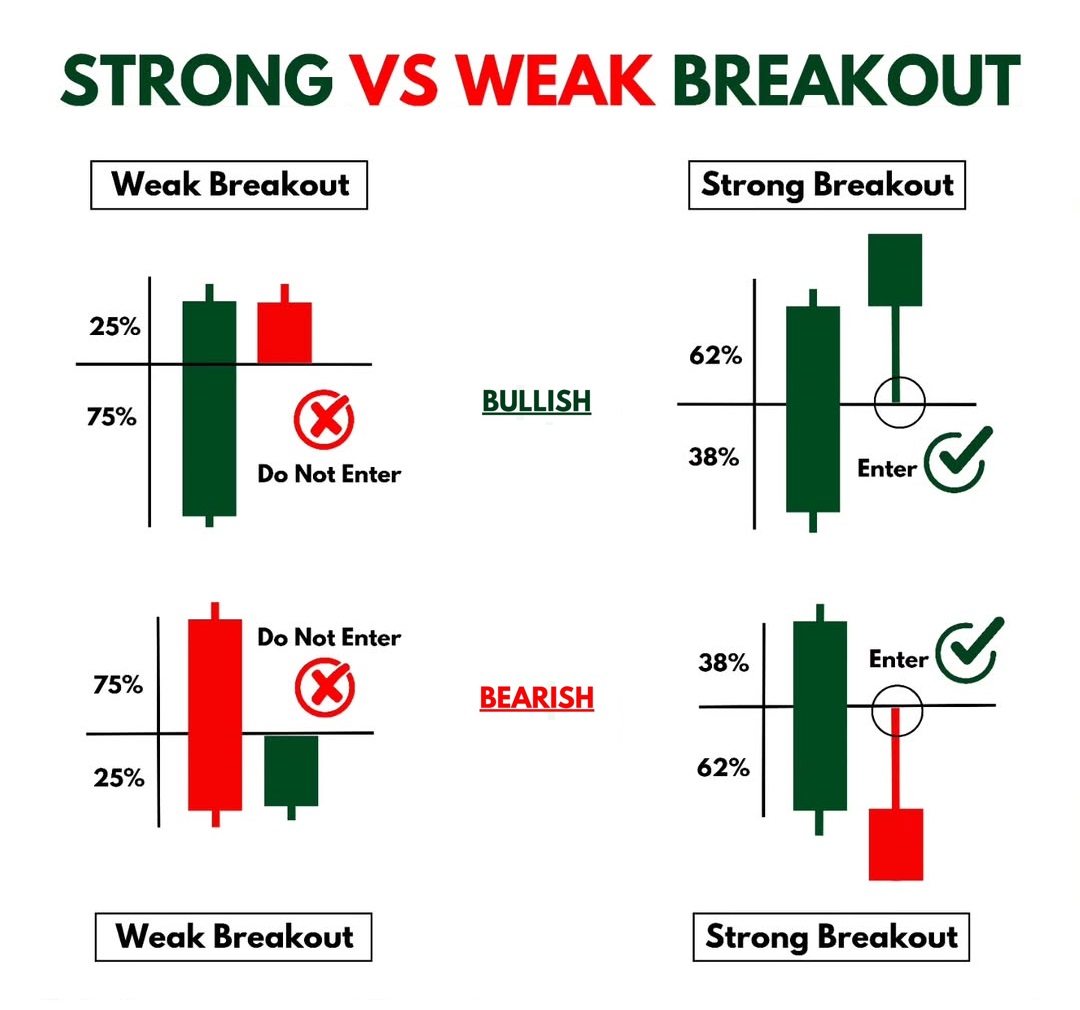
Spot the difference between a Strong vs Weak Breakout 📊💥 — Strong breakouts lead to big moves, weak ones may fade!
Like ❤️ & Repost 🔄 to spread the insight!
#StockMarket#BreakoutStrategy#TradingTips
Discussion point
Strong bullish trends =
✅ 20MA above 50MA
✅ Both MAs rising
✅ Wide MA gap expanding
✅ Pullbacks barely touch 20MA
But here’s the twist:
Some traders argue waiting for a 50MA touch gives better risk-reward.
🤔 Do you:
🟢 Buy shallow pullbacks (momentum style)
🔵 Wait for deeper pullbacks (patience pays)?
Reply & let’s hear your view 👇
BEST TRADING TIME YOU DIDN'T KNOW.
1.9:15 am-9:45am-- Momentum Trading
2.9:45am-11:00 am--Directional Trading
3.11:00 am--1:00 pm--Sideways Trading
4.1:00pm--3:30pm--Directional Trading.
5.10:30am-2:00 pm--More steady price action and volume.
6.9:15 am--10:30 am---High Volatility
7.2:00pm --3:00pm--Volatility increase. No matter what time speaks more than your Edge.
Moving Average Roadmap!📊
5 Day EMA- Strong Momentum
9 Day EMA- Trailing Stop Loss
10 Day EMA- Short Term Trend
20 Day EMA- Pullback Support
30 Day WEMA- Stage Analysis
50 Day EMA- Uptrend Defence Line
100 Day EMA- Big Price Dip
250 Day EMA- Value Zone
200 Day EMA- Long Term Trend ( Bulls last stand in uptrend and Bears last stand in downtrend)
Add Yours!!!!
Moving Average Roadmap:
1.MACD--Buy/Sell Signal
2.RSI--Overbought/ Oversold
3.Bollinger Bands--Volatility Levels
4.9 EMA--Short term Trend
5.21 EMA--Entry / Exit Levels
6.50 EMA--Place Stoploss
7.200 EMA--Long Term Trend
8.AVWAP--Intraday Breakouts
9.Adx--Strength of the Trend.
Do or Die-----Choose One !!!
🐻 Lo cutloss, taunya bullish 😭
Jujur aja, sering kan lo ngalamin yang kayak gini? 🤣
Buat lo yang :
> Belom bisa analisa mandiri
> Pengen dapet analisa dari koin jagoan lo
> Gapunya waktu banyak
Hari ini Cryptocium resmi launching :
➡️ CEKCOIN di https://t.co/pKulPCwJnV
Disitu lo bisa langsung dapetin :
✅ Informasi tentang kondisi koin yang lagi lo hold
✅ Lo bisa dapet analisa fundamentalnya juga tanpa ribet nyari informasi yang simpang siur.
Dapetin analisa nya cuma dalam 1 menit! 🔥
📌 NOTE : AKSESNYA FULL GRATIS !!