$btc M
You NOT ready for this parabola. Idk if launches June or July but I know by September we gon be laughing our fkn heads off.
This is the 5th and final of the greatest performing asset of the last 16 MF years. And yall think it’s just gon roll over
L M F A O!…H F S P!
Market Context
This is the most important foundation of my trading:
@Trader_XO was the first person to bring this to my attention and to this day his teachings still have a tremendous impact on my trading / process.
Market context should be one of the foundations of your trading. It helps you identify which trades you should be focusing on, from a more directional point of view.
Patterns don’t mean shit unless you are trading them in the right context, this goes for double tops / bottoms and even compression setups.
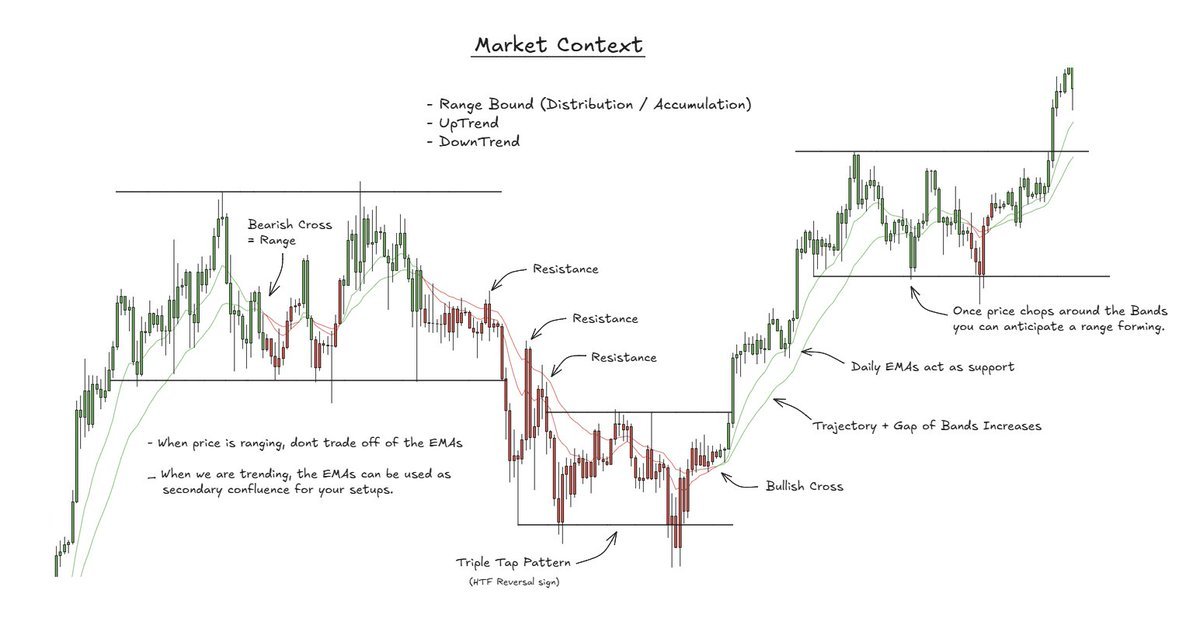
The daily / weekly 12/25 EMAs (TraderXO Macro Trend Scanner) is one of the simplest yet most efficient way to ensure your always on the right side of the trade.
In an uptrend, the daily bands will be green and price comfortably above. In a downtrend, the daily bands will be red, and they will act as resistance when price trades into them from the underside. In rotational (Range) environments you will see the daily bands more frequently cross both bullish & bearish.
My favourite tip for identifying a rangebound environment after an uptrend, is when we have the first bearish cross on the bands. Vis versa, in a downtrend you can wait for the first bullish cross to anticipate a rotational environment.
I urge you all to implement market context into your trading process and have clear rules defining how you identify each environment.
Read my latest article- “The mining business is miserable when supply is abundant and prices languish. But when the world really needs what you have—and can’t get it elsewhere—the rewards can be life-changing. Copper is at that inflection point” https://t.co/FUJmuWJWLV
@PARABOLIT A whole year of supply demand chopness in the 60-70k range. Btc just regularly slicing through it with 1 daily candle.
Stocks comfy at ath xau comfy at ath. Like last thursday we bout to make 90k support with a wick to 83k. Wouldnt be suprised to see a wick to 50ktodays shitshow
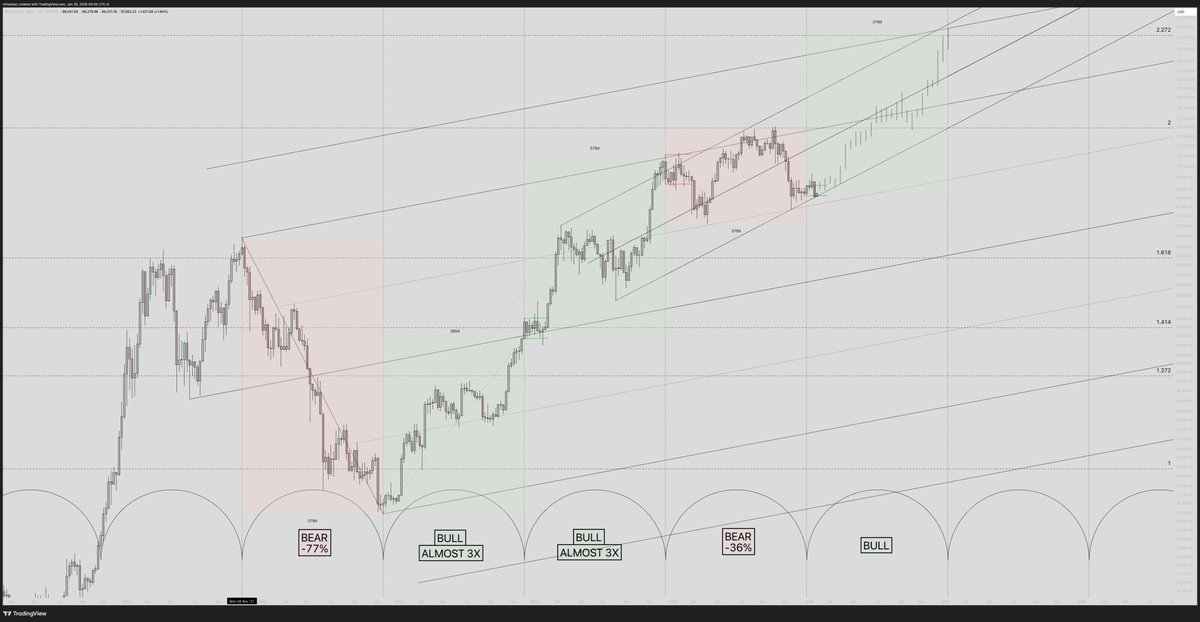
#Bitcoin's price retraced 36%, high to low, while overall correcting for a year.
The last bear market took a year.
The "bull market" we had ran for 2 years.
It's wild how sentiment is so far skewed to the downside that another "almost 3x" in a year feels impossible?
Most of crypto is behaving as they would, in a bear market.
Every Cycle we tell ourselves, "I won't round trip this time".
Yet we're conditioned to respond with inaction, saving our fear not for losses, but for the possibility of missing out.
It's not about right or wrong. It's my job to take risk-adjusted bets on the likelihood of being right. While always accounting for the chance of being wrong. $btc
Honestly. I’m aiming for closer to $300k+ now on $btc
As I’ve said throughout this bull the length and height this climax hits will relate to the dynamic of our corrections on the way up.
Same chart since 2019. Same structure. Just elongated final. Same bear to follow
@Trader_XO People do not realise that you share all the alpha you ll ever need to understand your thesis in your youtube channel, but mwah who cares about old price action vids.
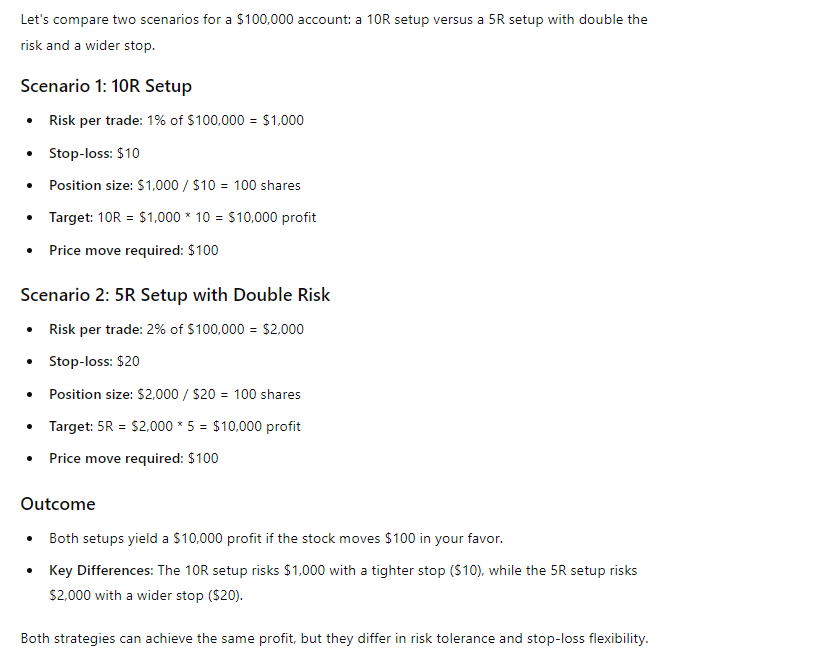
Why a high win rate isnt the holy grail?
Ok nothing new here but just sharing from my own experience:
In 2018, when I first started trading with leverage, I made the same mistake many new traders make, which is ultimately trying to chase a high win rate and if it wasnt a high win rate, it wasnt good enough.
A few losses would throw me off my process leading to over-leveraging, adjust entries on the fly, taking unplanned trades or skipping planned trades - just to name a few.
What's key to understand is that profitability isn’t about avoiding losses. It’s about expectancy.
Consider a simple model:
Account size: $100,000
Risk per trade: 1% ($1,000)
Win rate: 45% (45 wins, 55 losses)
Reward/Risk: +2R on wins, -1R on losses
Outcome after 100 trades: $135,000 (+35%)
Expectancy: +0.35R per trade
Even with a win rate below 50%, this system has positive expectancy, carries edge, and produces profits.
It isn’t flawless, yet there is so much room for improvement with a focus on trade selection, timing, and risk allocation, applying a better filter to select A+ trades and sizing up on them.
But the foundation is solid. Journaling and reviewing are what transform a basic edge into a sharper, more consistent one over time.
The math is simple. The real challenge is staying the course long enough to let it play out.
Most aspiring traders never make it to 100 trades because they are rattled by variance, size up too quickly, or abandon their process after a drawdown and eventually blow up, been there and done it many times in 2018-2019.
I would get to around 30-40 trades before taking a huge loss (-50% drawdown or completely blowing out) - hence of my "trading goals" was just to make it through to 100 trades, amongst many goals at that time.
The true edge isn’t just in the numbers, it’s in the discipline to stick to the process and the patience to refine it (the real work away from staring at the screen all day). That’s what separates compounding from blowing up.
Its a tough game to crack, let the numbers show you the way. Dont think about the end goal but the process that will help you get there.
@TheGoldPrairie What will differ this cycle is that the most dominant denominator against btc ($)will gradually and then all at once cause chaos in the markets by crashing hard.
I’ve been trading markets for 7 years now and it’s taken me until this point to become confident in my approach. Some people learn quicker than others. The one thing successful people don’t do is quit. Here are some things I’ve learnt over the years (I’ll add more over time) 👇
1.
Short term
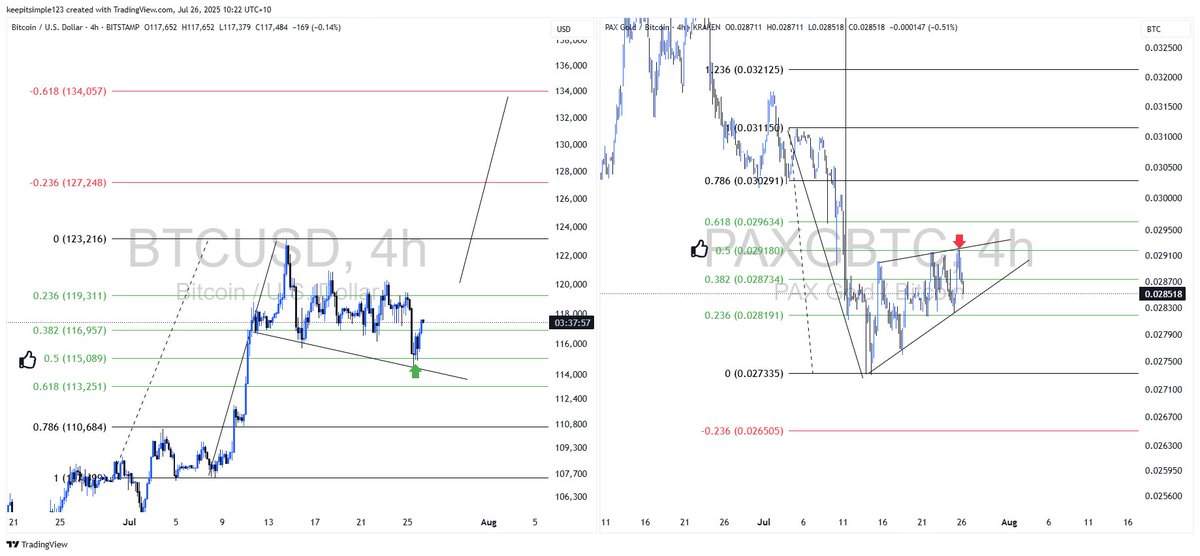
PAXG/BTC constructing a beautiful bear pennant respecting all fibs while BTC is busy constructing a Bull flag/pennant on the left .
Takeaway BTC is correcting bullishlly with trend up and the contrarian PAX chart trend down .
2.
This current cycle top
By measuring with the fibs from the Plandemic crash to the April 21 top one can clearly see the obvious .
BTC bottomed on the .5 fib
BTC has respected this set of fibs at every turn most recently finding the .236 extension and being rejected.
Yet it never gets mentioned ?
This is excellent because this brings into play the .618 at 369 K
Magic numbers
Once PAX breaks through the grey zone to reconcile its descending triangle fractal and once BTC breaks 124 and turns .236 into support its go time
3.
Do we see the 369K figure in the indicators confluent with fibs ?
Yes we do
So we have fibs and indicators agreeing .
Ad it stands I am forced to conclude BTC will reach 369 this current market structure