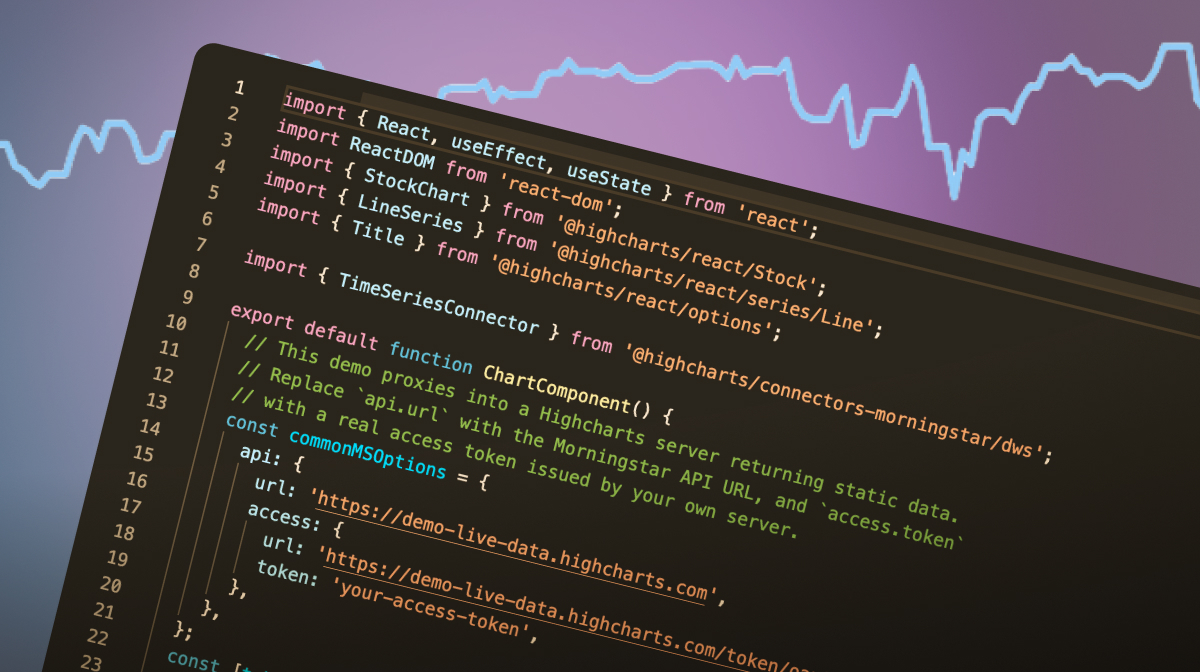
Working with Morningstar data in React?
Here's how to fetch fund data with the Morningstar DWS connectors and render it in a Highcharts React stock chart, all in a single component.
Read the full guide: https://t.co/J4Xd5S800t
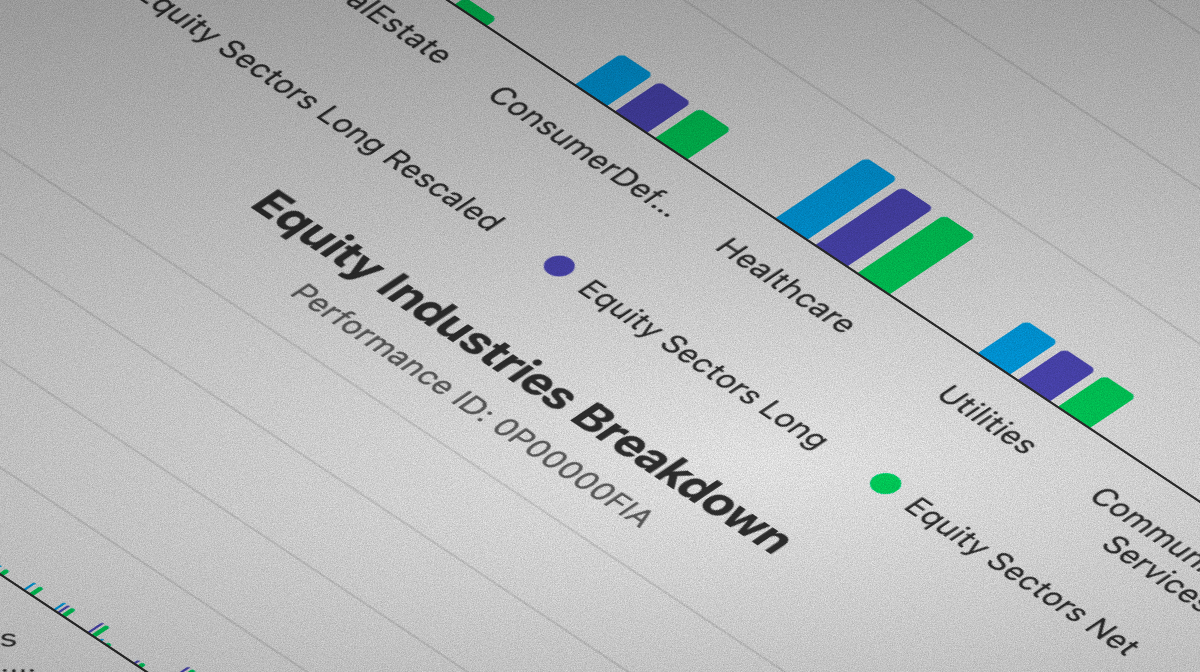
Working with Morningstar data?
Here's how to go from an empty HTML file to a working Highcharts chart using the Morningstar DWS connectors, without building your own mapping layer.
Read the full tutorial: https://t.co/z30aeltjPR
Also new for React developers: Highcharts demos now include React in the code tab. So you can see how a chart is built with the React components before you write a line of it: https://t.co/Dp7RjUq4Bq
Highcharts React v5.3.0 is out: automatic module loading for the generic Series component, faster Chart re-renders, and a dedicated SeriesLabel component.
View full changelog: https://t.co/hFEtkxC3Y3
#4: Veezoo
@veezoo uses Highcharts as the visualization layer for its natural-language analytics. Since the questions aren't known in advance, Veezoo builds a Highcharts config dynamically for each result, across 20+ chart types.
More in our blog post: https://t.co/sCbiu5aAbD
At Highcharts, everyone has that one favorite chart they've spotted out in the wild. We thought, why not share them?
Starting a thread series: Highcharts in the Wild 🧵
Also, if you've ever spotted Highcharts somewhere and went "oh nice", tell us about it!
#3: SteamDB
The assumption that devs love gaming is certainly true for us when we spot Highcharts while checking if a wishlisted game has ever gone on sale. SteamDB uses Highcharts to track prices, player counts, and trends of every game on Steam.
https://t.co/qprB5QfL3S
Scaling analytics needs more than features. It needs control.
Orbit Admin centralizes installations, tool and AI access, which charts include Orbit, branding, usage limits, and team management.
Explore the admin panel: https://t.co/PjNLGPMJQ8
Most dashboards are collections of independent charts.
Highcharts Orbit connects them into one analytics workspace with relationship discovery, shared filters, comparisons, focused layouts, page-wide AI, and shareable state.
See how it works: https://t.co/vWAcHpUL9z
Put analysis where the data already lives.
The Highcharts Orbit toolbar brings correlations, anomaly detection, forecasts, trend lines, filters, derived series, technical indicators, and more directly into any Highcharts chart.
Explore the Orbit toolbar: https://t.co/7gkVm9ikzv
Your chart shows a spike. Orbit helps explain why it is unusual and what may happen next.
Explore context-aware insights, anomaly detection, control limits, forecasting, trend lines, and technical indicators: https://t.co/UD4T6IzInH
🔭 Highcharts Orbit is now in beta.
Explore, analyze, forecast, and transform data directly inside any Highchart.
New in beta: connect analysis across a dashboard and manage deployment, tools, AI, branding, and access in one place.
Try it: https://t.co/A8pROrXv4b
Chartchooser MCP brings Highcharts into Claude. Paste in your data, answer five questions about what you're charting, and it hands back a working Highcharts HTML file.
Read more about it: https://t.co/LqwfI2KQhQ
Highcharts React v5.1.0 is out. A small maintenance release with a peer dependency update to v12 and a handful of bug fixes. Full changelog: https://t.co/LV0BTuHD5I
Highcharts v13 is officially here.
If you tested the beta, now is a good time to move to the stable release. And if you're upgrading from v12, the blog post covers what to check.
Full release post with code examples and details: https://t.co/IURjmJAKwB
.@Highcharts gives React devs production-ready charts, grids, and financial visualizations. Accessible by default. LLM friendly. Trusted by 80% of the world's largest 100 companies.
Try it for free!
Highcharts is heading to @ReactSummit 2026 in Amsterdam on June 12 as a sponsor. If you're there, come find the team for live demos of React v5, the new MCP servers, Highcharts Grid, Orbit, and the accessibility module.
#3: SteamDB
The assumption that devs love gaming is certainly true for us when we spot Highcharts while checking if a wishlisted game has ever gone on sale. SteamDB uses Highcharts to track prices, player counts, and trends of every game on Steam.
https://t.co/qprB5QfL3S