Highcharts is heading to @ReactSummit 2026 in Amsterdam on June 12 as a sponsor. If you're there, come find the team for live demos of React v5, the new MCP servers, Highcharts Grid, Orbit, and the accessibility module.
#3: SteamDB
The assumption that devs love gaming is certainly true for us when we spot Highcharts while checking if a wishlisted game has ever gone on sale. SteamDB uses Highcharts to track prices, player counts, and trends of every game on Steam.
https://t.co/qprB5QfL3S
#3: SteamDB
The assumption that devs love gaming is certainly true for us when we spot Highcharts while checking if a wishlisted game has ever gone on sale. SteamDB uses Highcharts to track prices, player counts, and trends of every game on Steam.
https://t.co/qprB5QfL3S
At Highcharts, everyone has that one favorite chart they've spotted out in the wild. We thought, why not share them?
Starting a thread series: Highcharts in the Wild 🧵
Also, if you've ever spotted Highcharts somewhere and went "oh nice", tell us about it!
#2: GitHub
As someone from the team said: "There's something beautifully recursive about it. Highcharts, a library for visualizing data, used by GitHub to visualize contributions to Highcharts."
More on how GitHub uses Highcharts: https://t.co/QyEkDvbANy
Highcharts 12.6 is now available, with a focus on performance and new ways to visualize complex data.
Explore what’s new and how it works:
https://t.co/S2x7nOfPYl
The question: can we combine human-written descriptions, sonification, markup, and AI to make interactive charts both accessible and trustworthy?
Øystein Moseng (Highcharts) and Jay Nemchik and Ted Gies (@ElsevierConnect) will demo prototypes and share user research findings during their session at this year's CSUN ATC.
If there, come join us on March 11, 3:20 PM PT.
#CSUNATC26 #a11y #dataviz
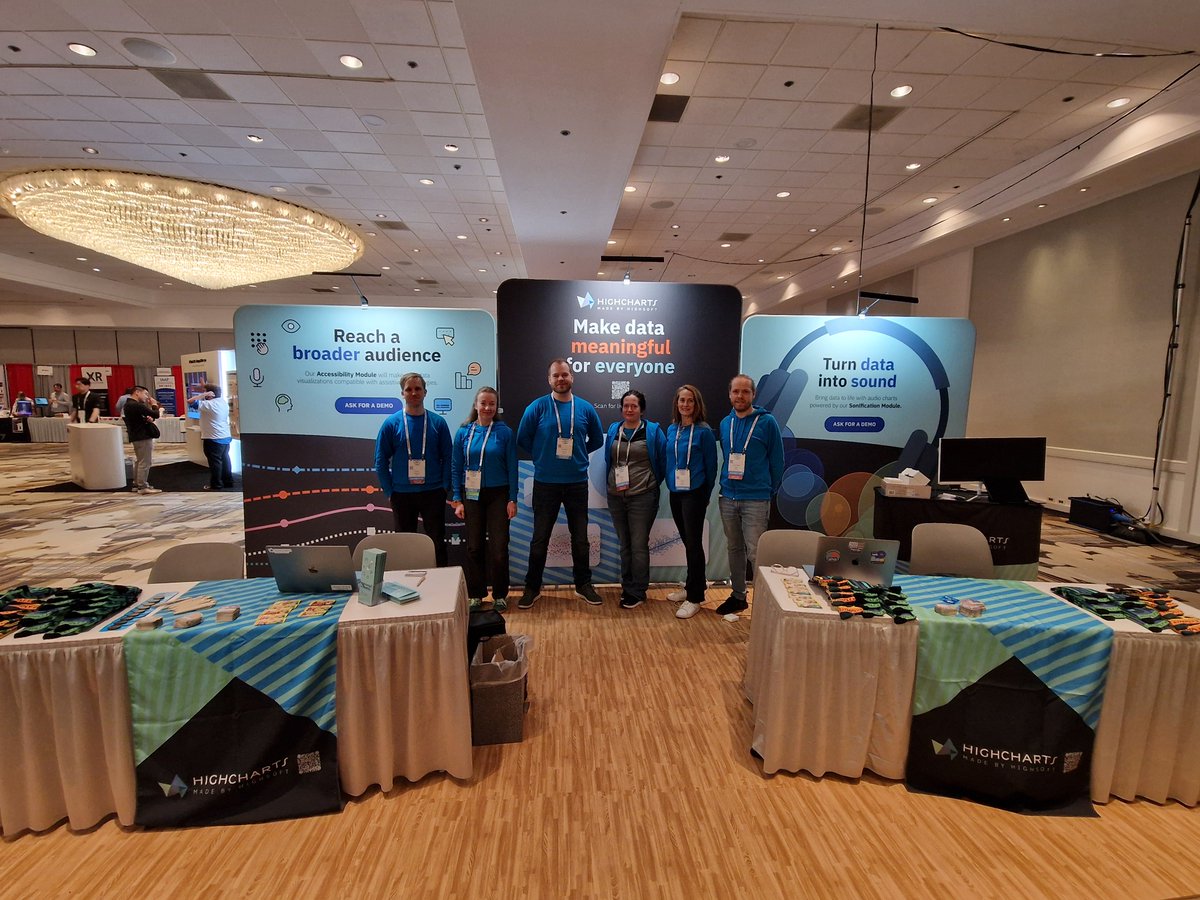
Last year at #CSUNATC26 , we explored how different chart types need different accessibility interaction models. This year, we're adding a new layer: AI-assisted chart exploration 📊
At our booth, we'll be sharing demos from our accessibility demo hub, including interactive examples for screen readers, keyboard users, sonification, and AI-assisted exploration.
Preview some of our accessibility work here: https://t.co/03HzyZ2CXf
Build an economic blocs map with Highcharts and React 🌍
This tutorial walks through setup, working with TopoJSON, and rendering interactive maps using the MapsChart component.
Start building: https://t.co/eF6gaXWrMM
Ever wondered why Greenland looks huge on some maps? Map projections matter. A lot.
Explore how the world changes across Equal Earth, Mercator, and other projections in this demo: https://t.co/KAaMbfoFLb
Highcharts 12.5 is out and focuses on practical improvements:
📊 A new way to visualize hierarchical data with dendrograms
🎯 Finer control over legend layout
🌓 A simpler approach to light and dark theming
Learn more about the details: https://t.co/CValZJJPwk
Want to see Grid Pro in action?
Join us November 19 at 1 PM ET for a live tutorial where Øystein and Stian will show you how to edit and validate data seamlessly with Grid Pro, giving you practical tips for building cleaner data tables.
Register: https://t.co/2VVU939r71