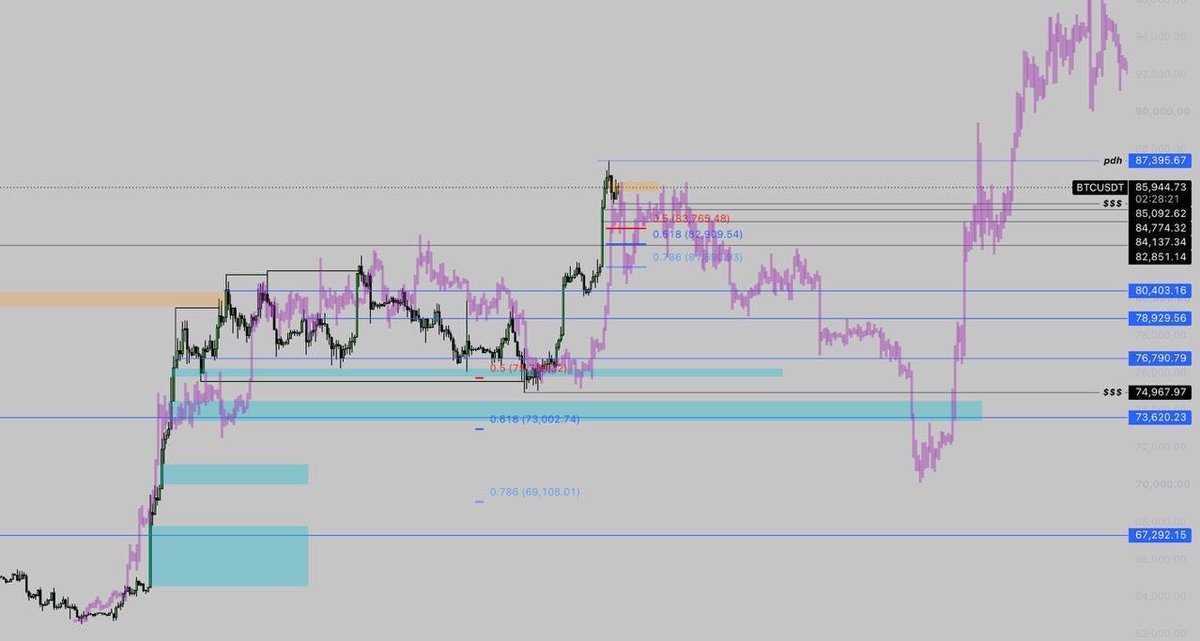
$BTC: The liquidity in the downside is swept
Greedy bulls are liquidated, market is ready
My two cents: bottom is in now at $73,500
I keep holding buy orders in case I am wrong
#Bitcoin - Weekly Market Commentary
In Depth Technical and Psychological Analysis
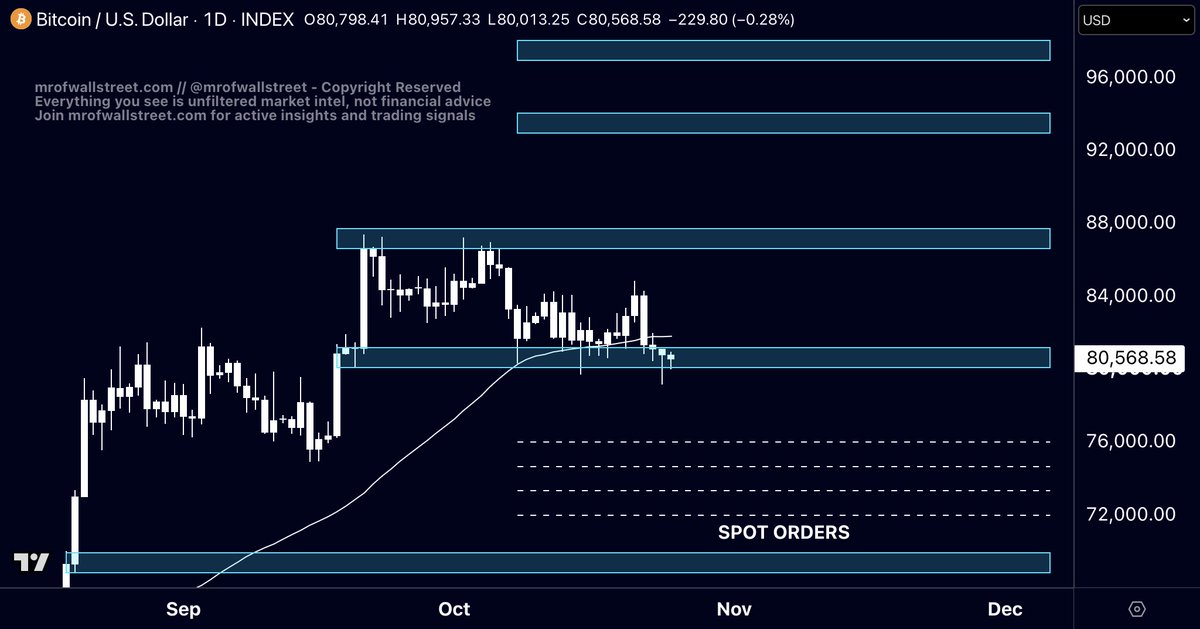
Two weeks ago I told you Bitcoin is trading in the 80-87k range and it will keep moving sideways within this range until it breaks to higher targets. I gave you first target of 93k and second target of 97k. Both my targets remain unchanged and as you can see in the chart below Bitcoin is still trading in the range I have told you about. The reason why it keeps trading in this range is to make retail tired and ultimately make them sell their bags right before we move higher again. The market makers only goal is to make investors bored with the price action and give up. The best way they have to do this is to print a boring sideways movement. Once they finish printing the sideways movement, the real move higher will show up and you will see my 93k target play out next.
It’s important to highlight Bitcoin is in a confirmed bull market since it broke 83k. This is important to know because it shows higher is coming. However, there’s a key variable to understand that I see most bullish actors disregarding. During bull markets we often see flash crashes occurring to further strengthen the market by filling downside spot orders at the same time it forces leveraged positions to exit at a loss. At the time I gave you my higher targets, I also talked about the possibility of market makers hunting the downside liquidity in the 72-76k region and I added buy orders there. I am still holding those buy orders in case the market allows us to see lower before we see higher. Bulls max pain is the 72k level, which is exactly why I placed orders at 72-76k.
I am very bullish mid term and I am very bullish long term. My first mid term target is 130-140k and my second mid term target is 180-200k. Short term Bitcoin is trading at the 80k support, which is making me become very bullish again, just like I got very bullish at 74k right before the last leg higher. This however doesn’t turn me into a blind bull, and I recognize there’s liquidity on the downside that could easily be hunted with a geopolitical, macroeconomic or even political event. And in case it happens, I am ready to buy more. I keep holding all the BTC bought at 60-64k and ETH bought around $1,850 and I have no intention to sell anytime soon.
Weekly Calendar: This week we will have the biggest earnings week of the quarter with $30 trillion USD worth of companies reporting earnings. I am carefully looking at Microsoft, Google, and Amazon earnings this week since they are the biggest companies and their influence on the market is big. A positive result from these companies can easily make both the SP500 and NQ100 reverse their recent bearish price action and score new highs. FOMC is also coming this week. I am expecting to see no rate cuts since it’s the last FOMC before the midterm elections, regardless of the high inflation numbers. I expect a volatile week ahead.
More only at https://t.co/mABIXSCDKb
THIS POST IS NOT FINANCIAL ADVICE BUT MY PERSONAL OPINION ONLY
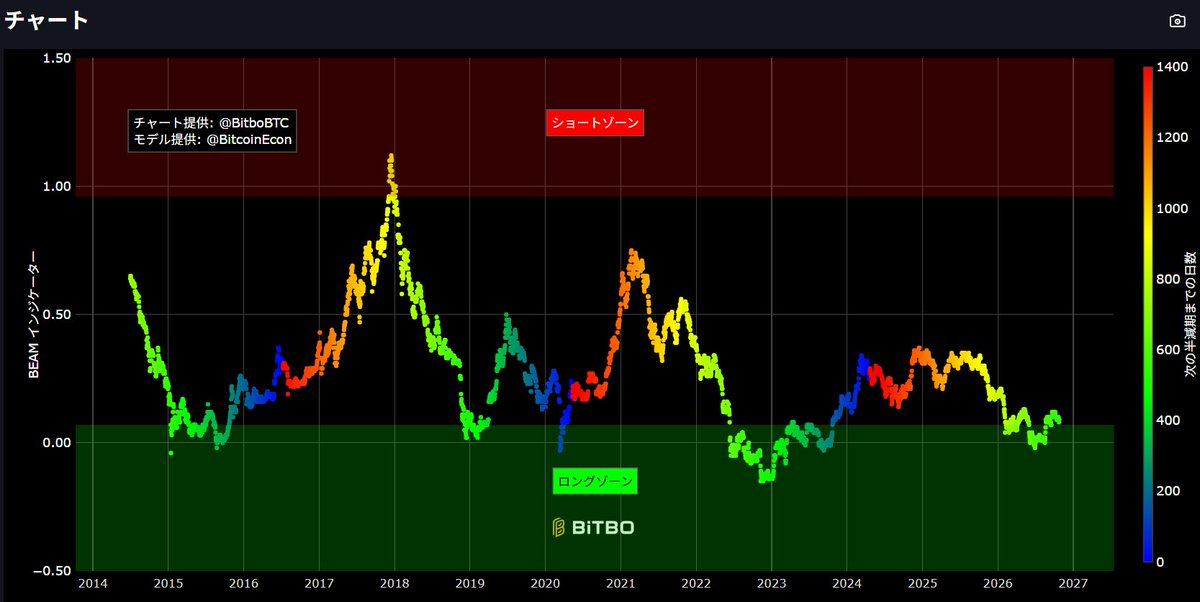
Should Bitcoin continue with the most remarkable cyclic patterns of any market in the past 15 years, an investable low is scheduled for Sep/Oct 2026. That low might or might not penetrate the Feb 2026 low. The next high (should patterns continue) will be between $300k and $500k in Sep/Oct 2029
I will announce tradeable thrusts via Factor and @BitcoinLive1
https://t.co/Bq1PhjnRHa
and https://t.co/S9kNCOIrWc
Hey @scottmelker
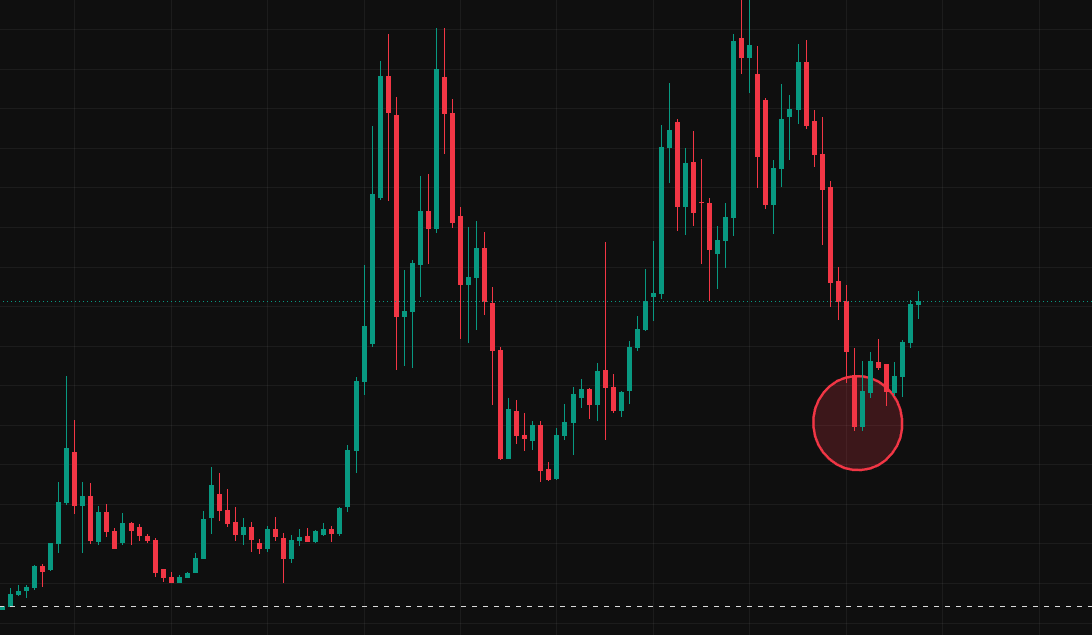
If Bitcoin can regain the broken parabolic slope then $BTC is on target to reach the bull market cycle top in the $125k to $150K level by Aug/Sep 2025, then a 50%+ correction
MY 2026-2027 BULL RUN ROADMAP
September → Mini-pump
October → Last dip
November → Recovery
December → $BTC ATH
January → $ETH ATH + altseason
February → Euphoria
March → Distribution
April → Anxiety
May → Liquidation
June → Bear market
Screenshot this.
Come back in June.
ETH/BTC
0.030 — 100-week moving average
0.031 — Positioning zone
0.035 — Hard to buy. Too early to sell.
0.040 — FOMO starts.
0.045 — First scale-out.
0.050 — Second scale-out.