Yields into supply.
$XOP sector into supply.
$OIH sector LT.
Dollar index supply.
#silver hitting $55
We must ask...is it time to buy back the long term positions?
I'll share my take tomorrow
⚠️ DEUTSCHLAND STEUERT MIT NUR RUND 51 % GASSPEICHERFÜLLUNG AUF DEN WINTER ZU - POLITISCH IST DAS EIN VERMEIDBARES RISIKO.
Der Chart zeigt die ausgeprägte Saisonalität der europäischen Gasspeicher:
🟢 April bis Oktober: Einspeicherphase
🔴 November bis März: Entnahmephase
Europa liegt aktuell bei rund 63 % und damit knapp 18 Prozentpunkte unter dem Durchschnitt der Jahre 2021–2025.
Deutschland steht mit rund 51 % sogar noch deutlich schwächer da.
Auch die Bundesnetzagentur bestätigt, dass die deutschen Speicherstände erheblich unter den Vergleichswerten früherer Jahre liegen und nimmt diese Entwicklung nach eigener Aussage „sehr ernst“.
Gleichzeitig gilt weiterhin die Frühwarnstufe des Notfallplans Gas und trotzdem wird die Wintervorsorge noch immer primär den Gashändlern überlassen, die ihre Beschaffung verständlicherweise nach Preisen und Wirtschaftlichkeit optimieren.
Genau hier liegt für mich das politische Versäumnis:
Eine strategisch wichtige Energieversorgung darf nicht davon abhängen, dass…
➡️ der Herbst mild bleibt,
➡️ norwegische Pipelineflüsse stabil bleiben,
➡️ weltweit genügend LNG verfügbar ist,
➡️ Asien Europa nicht bei #LNG-Ladungen überbietet
➡️ und die verbleibende Einspeicherzeit problemlos ausreicht.
Ab November beginnt normalerweise die Entnahmephase. Was bis dahin nicht eingespeichert wurde, muss im Winter zusätzlich über laufende Pipeline- und LNG-Importe beschafft werden, ja genau, ausgerechnet dann, wenn die Nachfrage und häufig auch die Preise steigen.
Was könnte das für Deutschland bedeuten?
📈 höhere Gas- und Strompreise
📈 steigende Heizkosten
📉 zusätzlicher Kostendruck auf die Industrie
⚠️ stärkere Abhängigkeit vom globalen LNG-Markt
⚠️ geringerer Puffer bei Kältewellen oder Lieferausfällen
Eine akute Gasmangellage ist damit noch nicht bestätigt. Die Bundesnetzagentur bewertet die Versorgung aktuell als "stabil".
Aber verantwortungsvolle Energiepolitik darf sich nicht nur am wahrscheinlichsten Szenario orientieren. Sie muss auch einen kalten Winter, technische Ausfälle und geopolitische Störungen aushalten können.
Private Haushalte wären in einer tatsächlichen Mangellage zwar vorrangig geschützt. Der erste wirtschaftliche Schaden würde jedoch wahrscheinlich über explodierende Preise und Belastungen beziehungsweise mögliche Verbrauchsreduktionen der Industrie entstehen.
Versorgungssicherheit bedeutet nicht, erst zu reagieren, wenn der Markt bereits unter Stress steht.
Warum wurde dieser strategische Sicherheitspuffer nicht früher und konsequenter aufgebaut?
Auf geht`s💪
Wissen ist Vermögen.
Trends erkennen.
Vorausschauend handeln.
TSC | Trend Serra Capital
https://t.co/jYkrHHG8W3
$XLE $OXY $APA $DVN $APA $COP
These video updates are provided for educational purposes only and should not be considered investment or trading advice. Always carry out your own research and, where appropriate, seek independent financial advice before risking your capital.
Or simply follow random people on the internet or join signal group expecting consistent results. However, without a solid understanding of technical analysis and risk management, simply copying trades is unlikely to lead to long-term success.
In this video, I demonstrate how I build a low-risk, high-reward trade plan using money flow analysis alongside a basic understanding of supply and demand.
The $XLE appears to be in the early stages of a new weekly phase. We saw a strong advance during the first minor phase, followed by what currently looks like a healthy flag within a positive higher-timeframe context. The recent decline has been relatively shallow following a late peak, which aligns with the expectation outlined in DC.
Price has now returned to an area where buyers previously overcame sellers, making it a location worth monitoring.
From here, we have a clear framework:
Context – Why the trade is worth considering
Entry – The price area we're interested in doing business
Invalidation – Where the idea is proven wrong
Exit – Where profits would be taken if the thesis plays out.
Within DC, there are hundreds of potential trade ideas. Some will reach our desired entry levels, while many won't—and that's perfectly normal. Patience and selectivity are part of the process.
Your job isn't to predict the market. It's to extract objective facts from the chart and use them to build a logical, evidence-based thesis and that should help with your osychology.
As always, thank you to everyone who continues to support the feed.
Jeder weiß inzwischen, dass die 12-Uhr-Regelung an deutschen Tankstellen nichts gebracht hat. Ganz im Gegenteil.
Dass so etwas dann trotzdem einfach weiterlaufen gelassen wird, macht mich fertig.
In jedem normalen Unternehmen würde man die Fakten analysieren und diesen Quatsch anschließend schnellstmöglich wieder abschaffen.
Im Politik-Deutschland der Neuzeit kann davon ausgegangen werden, dass wir die Regel noch einige Jahrzehnte mitschleppen werden.
Wahnsinn. Und doch irgendwo rational. Der Staat ist der größte Profiteur hoher Spritpreise.
💰 $BTC is heading towards $69K (200 Week EMA and Volume Imblance).
We'll be looking to short that zone. The move could coincide with next week's FOMC meeting.
Investing $10k a year into yourself is the superior way to becoming a millionaire.
You vote with your money for what you believe in.
1) Yourself
2) Companies of those who believe in themselves
Both produce 2 different forms of financial freedom:
1) has freedom to create their economic conditions
2) has freedom dependent on economic conditions
$NDAQ $TLT $HYG $MAGS
video analysis 11th July 2026
These video updates are for educational purposes only and should never be considered as investment or trading advice. Always consult and expert before putting your capital at risk. The key to successful trading and investing is ownership.
In this video update I have presented the correlation between the $HYG and risk markets. When we witness declines in that chart we also see declines in the stock market and other risk markets, such as
That chart is moving towards a period of potential risk and that syncs with the $MAGS $NDAQ and
There is a period into August which seems quite favourable for these markets, however I would urge caution into range highs (if indeed we do see that occur and certainly the move higher seems likely in $SPX ) because data suggests a decline is pending.
has hit the first objective following the weekly low and that was the Q on the .618. It is likely it will push higher into late July or August and a move towards 68K or higher would not surprise me. In 2024 this market ranged for 240 days around these levels, therefore this choppy pa is likely to continue.
Looking out to Q4, that seems more favourable based on the $HYG chart and I would imagine any drop into late summer or early Autumn will be bought up in the stock market which is being driven by a few AI related stocks. of course significantly weaker than those assets.
For bitcoin:native the session vol level around 60k needs to hold for bulls.
As always, thanks to those who support the feed.
And there we go and this weekly phase is very likely to be set negative
Two neutral cycle components with a negative energetic force applied = downtrend and a protracted range that took one month to break higher os balance, therefore 2+2 = 4
This feed is currently shadow banned so you may not receive any updates
bitcoin:native ethereum:native
$TSLA analysis 31st May 2026
These video updates are for educational purposes only and should never be considered as investment or trading advice. The key to success is trade ownership and having a system that you understand on a deep level. This is why signal groups will lose you money.
TESLA put in a macro low in April 2026 and has a macro low due way out in late September or early October.
It has reclaimed the range and overtime it is likely to make its way through value, therefore any dip into demand is likely to be bid and push through the range as there is no supply imbalance until outside value. There is a key low due later in June which indicates the asset will likely pull back into that tf.
Of course the high reward and low risk entry was the reclaim of the range and again on May 18th into demand into the ideal low, but any dip into demand will likely hold for reasons explained on video.
As always, thanks to those who support the feed.
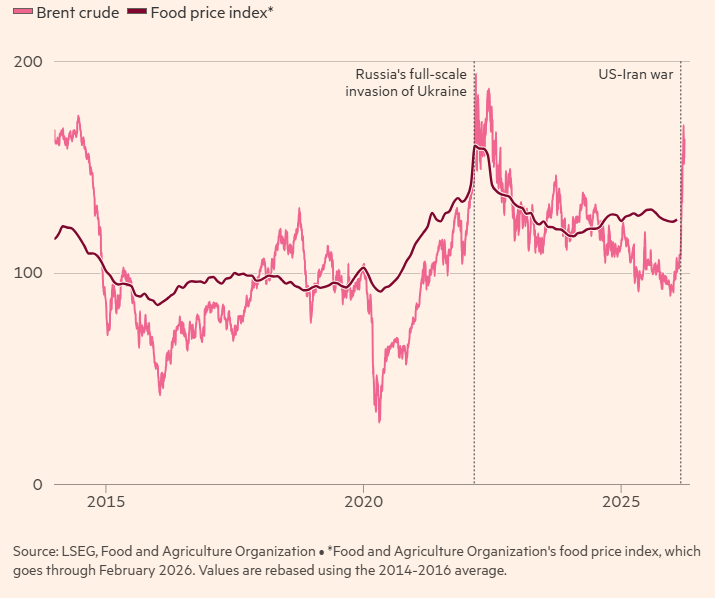
Alle reden über Öl. Über Benzinpreise. Über Gaspreise.
Niemand redet über den nächsten Schock: deine Lebensmittel.
43 Prozent des wichtigsten Düngemittels der Welt werden durch die Straße von Hormuz verschifft. Seit vier Wochen steht der Verkehr still. Und Dünger kann man nicht überspringen. Ohne Stickstoff, kein Ertrag. Ohne Ertrag, kein Essen.
Der Krieg im Golf trifft nicht nur dein Auto. Er trifft deinen Teller.
Moderne Landwirtschaft funktioniert so: Erdgas wird zu Ammoniak verarbeitet. Ammoniak wird zu Harnstoff. Harnstoff ist der meistgenutzte Stickstoffdünger der Welt. Ohne ihn wächst auf kommerziellen Feldern fast nichts in den Mengen, die 8 Milliarden Menschen brauchen.
Das Problem: Ein Drittel des weltweit verschifften Harnstoffs kommt aus dem Persischen Golf. 45 Prozent der globalen Schwefelexporte, ein Schlüsselrohstoff für Phosphatdünger, ebenfalls. Zwei von drei essenziellen Pflanzennährstoffen hängen direkt an der Meerenge, durch die seit Kriegsbeginn kaum noch ein Schiff fährt.
Dawid Heyl, Portfoliomanager bei Ninety One, bringt es auf den Punkt: Man kann eine Saison Kali auslassen. Man kann eine Saison Phosphat auslassen. Aber Stickstoff kann man nicht auslassen. Der muss jedes Jahr in den Boden. Ohne Ausnahme.
Der Harnstoffpreis in Ägypten, ein globaler Referenzwert, ist seit Kriegsbeginn von 400 bis 490 Dollar pro Tonne auf rund 700 Dollar gestiegen. In den USA kostet Harnstoff im Einzelhandel 677 Dollar pro Tonne, 11 Prozent mehr als vor einem Monat. Ammoniumnitrat hat die 930-Dollar-Marke durchbrochen. Der höchste Stand seit Mai 2023.
Und das Timing könnte nicht schlimmer sein. Auf der Nordhalbkugel läuft die Frühjahrspflanzung. Jetzt. In drei bis vier Wochen muss in den USA der Mais in den Boden.
Indien ist der zweitgrößte Düngemittelverbraucher der Welt. Ein Drittel des Bedarfs wird importiert. Und die eigene Produktion? Hängt am Gas. 40 Prozent des indischen Flüssiggases kamen aus Katar. Aus dem Land, dessen größte Gasanlage durch iranische Angriffe beschädigt wurde. Die indische Regierung hat die Gasversorgung der Düngerfabriken bereits auf 70 Prozent der Normalkapazität gedrosselt.
Bangladesch trifft es härter. Vier von fünf staatlichen Düngerfabriken stehen still. Das restliche Gas wird in Kraftwerke umgeleitet, um Blackouts zu verhindern. Ein Land mit 170 Millionen Menschen, das seinen Reis normalerweise selbst produziert. Wenn die Düngerfabriken nicht rechtzeitig zum Monsun im Juni wieder laufen, muss Bangladesch Reis importieren. Genau dann, wenn auch alle anderen importieren müssen.
Algerien hat die Gaslieferungen an seine Düngerfabriken um 50 Prozent gekürzt. In der Slowakei hat mindestens eine Fabrik die Produktion komplett eingestellt.
Alzbeta Klein, Chefin des Internationalen Düngemittelverbands, fasst die Lage in einer Rechnung zusammen: Die Lagerkapazitäten für Dünger liegen bei 10 bis 30 Tagen. Der Krieg dauert dreieinhalb Wochen. Dünger ist riesig, sagt sie. Man kann ihn nicht in die Tasche stecken. Die Lager laufen leer.
Und hier wird es systemisch.
2022, nach Russlands Einmarsch in die Ukraine, wurde eine globale Lebensmittelkrise ausgelöst. 349 Millionen Menschen wurden in Hunger getrieben. Aber damals ging es um Sanktionen und Logistik. Die Getreiderouten im Schwarzen Meer waren blockiert, aber Getreide konnte woanders angebaut werden. Handelsströme wurden umgeleitet. Sanktionen angepasst.
Chris Lawson von CRU, einem der führenden Rohstoffdatenunternehmen, sagt: 2022 fand man Lösungen. Diesmal ist es ein rein physisches Limit.
Denn Dünger kann man nicht einfach woanders herstellen. Stickstoffdünger braucht Erdgas. Phosphatdünger braucht Schwefel. Beides ist an Geografie und Infrastruktur gebunden. Konzentriert in wenigen Regionen. Und genau diese Regionen sind jetzt abgeschnitten.
In den USA waren die Lebensmittelpreise im Februar noch moderat: plus 1,1 Prozent im Jahresvergleich. Stephanie Roth von Wolfe Research rechnet vor, was kommt. Selbst wenn der Krieg innerhalb von Wochen endet, steigt allein durch die Düngerstörung die US-Lebensmittelinflation von rund 2 auf 4 Prozent. Wenn die Kämpfe in den Sommer hineinreichen, wird sie zweistellig.
Für Deutschland, wo Lebensmittel 10 Prozent des Verbraucherpreisindex ausmachen und Haushalte nach drei Jahren Dauerteuerung seit dem Ukraine-Krieg bereits am Limit sind, wäre ein neuer Preisschub bei Grundnahrungsmitteln politisch explosiv.
Die Forschung von Peter Alexander an der Universität Edinburgh beziffert das Worst-Case-Szenario: Wenn Düngerpreise von 300 bis 350 Dollar auf 900 bis 1.000 Dollar steigen und dort bleiben, könnten die globalen Lebensmittelpreise um 60 bis 100 Prozent steigen. Bis zu 100 Millionen zusätzliche Menschen würden in Unterernährung abrutschen.
Das UN-Welternährungsprogramm warnt bereits: 45 Millionen zusätzliche Menschen könnten bis Mitte des Jahres in akute Ernährungsunsicherheit fallen. Zusätzlich zu den 318 Millionen, die schon jetzt betroffen sind. In Somalia sind die Preise für Grundnahrungsmittel seit Kriegsbeginn um 20 Prozent gestiegen.
Und dann beginnt die Spirale, die 2022 alles verschlimmert hat. China hat Düngerexporte eingeschränkt, um den eigenen Markt zu schützen. Russland signalisiert Exportlimits. Indien könnte erneut Reis-Exportbeschränkungen verhängen.
FAO-Chefökonom Máximo Torero benennt die Falle: Jedes Land wird zuerst an seine eigenen Bürger denken. Aber wenn alle egoistisch handeln, kaufen die Reichen mehr und die Armen bekommen nichts.
Die Welt redet über Ölpreise und Tankstellen. Dabei wird die eigentliche Krise in drei Monaten sichtbar. Nicht an der Zapfsäule. Im Supermarkt. Auf den Feldern. In den Ländern, in denen eine verpasste Ernte keine Unannehmlichkeit ist, sondern Hunger.
In diesen Recherchen steckt eine Menge Arbeit. Wenn dich solche Makro Insights interessieren und dir helfen, interagiere gerne mit dem Post. 🧡
💥BREAKING
January Rate Cut chances Are still 50%
US Core CPI has dropped to its lowest level since March 2021.
The Fed's claim of rising inflation is absolutely wrong.
10,000$ Giveaway to kickstart 2 people’s trading journeys (5k$ each)
To enter :
•Like & RT this post
•Make sure to be following me
•join TG: https://t.co/9qTvfV5bCQ
Winner will be announced on Telelgram on the 15th of January 💎.
Comment if you ever benefited from trading with me or how would 5000$ help you 👇!
I cancelled the last one & made this giveaway with simpler terms so everyone can join. But the more active you are (comments & RTs) the higher chance you get!
#Bitcoin #كريبتو
Will post proof of the winners as i always do with big giveaways.
$FXI $BABA
One very simple thing you can do to increase the probability of a successful trade is to use correlated charts. I have been through this many times.
This is Hurst's Principal of Commonality, which states that all equities have many elements in common. Therefore similar classes of tradable assets have price movements with much in common and for this reason we must ALWAYS conduct a group analysis.
And here's another gift to start your 2026, and whilst the herd panic buy metals and are distracted by green candles and crypto X now addicted to the silver chart, we take profits on some huge trades in sector and sit back and observe multiple markets and simply find another opportunity.
And of course we have our plans in place for $HG $XAU and $XAG and those markets will offer a lot more, but likely need a period to correct and push out the panic buyers.
These video updates are for educational purposes only and should never be considered as investment or trading advice. Always do YOUR OWN analysis.
Thanks to those few who continually support the feed. It really does help and I appreciate the comments. If you do find these update video helpful, then pls consider supporting the feed.
In the meantime, I wish you all a healthy 2026.
$BTC update 6th December 2025
These video updates are for educational purposes only and should never be considered as investment or trading advice.
$BTC continues to trade in a period of risk with weakness in money flow data. The 93k level, which is the Y on the .382 on the internal SR continues to hold price. The highest probability is for a period of chop which will likely break to the downside into early 2026, which has been the long term forecast on this market and it would be reasonable to see the contract trade towards the .236 which is around 76k.
There is a dominant cycle at work currently which needs to be satisfied and that will likely be in the level where demand far exceeds supply.
$BTC could spike towards 97k but that would not repair the damage and it would likely fail and that would not change this forecast.
As always, thanks to those who support the feed. I do not understand why this page is shadow banned (it has been for several weeks now).