I would like to think Bitcoin is down past week because of the dollar, which has broken through the 100.50 tripwire - a concern for risk assets generally - but with the MOVE index down overnight and equities bid hard, it seems it is more likely the Saylor Vortex that is at play
ALTSEASON WATCH #3
Everyone wants ALTSEASON.
But the market has one gatekeeper:
BTC Dominance.
2017 did not begin because people believed in altcoins.
2021 did not begin because the crowd was ready.
Both rotations started when BTC dominance lost control and ETH/BTC began to wake up. That is why this chart matters.
Top panel:
BTC dominance is sitting inside the 2026 gatekeeper zone.
Bottom panel:
ETH/BTC is pressing against the longterm line that has suffocated rotation for years.
This is the entire altseason question:
Can Bitcoin dominance start losing control while ETH/BTC finally stops bleeding?
If BTC.D breaks lower
and ETH/BTC breaks higher,
the market changes character. Bitcoin stops being the only game. Risk starts rotating.
Altseason does not begin when the crowd believes. It begins when the gatekeeper starts losing control.
BTC.D is the gatekeeper.
ETH/BTC is the key.
TOTAL3/BTC is the proof.
One chart can be noise. Alignment is the signal.
yeah bearish from 74 thats ok.....they faked us out to the upside and crashed it down to 60K....Devil-Move
the major support was in january, february, march, april ... and now ... its since 2021 there... and until this support at 58.7K is not broken (with a fully monthly close below) there is no reason to be bearish or fear.
Watch the 3M-Chart. The quarterly bearish volume is dying into the major support. 🤝
just asking because you sound little bit scarry the last days. No fear we will win ❤️
https://t.co/cVw1MLXHDY
https://t.co/TgMgXTb8o2
Why I'm Bullish on Kevin Warsh as Fed Chair:
Battle-tested: ex-Morgan Stanley, youngest Fed Governor ever, crisis veteran.
Growth hawk: Sees AI driving a 1990s-style productivity boom — allows strong growth + lower neutral rates without inflation.
Discipline + optimism: Shrinking the bloated balance sheet while keeping policy supportive of risk assets.
Crypto-positive: Views Bitcoin as a legitimate diversifier and "policeman" on policy.
Warsh = credible independence + pro-innovation stance.
Markets should like this combo. Bullish signal for equities, tech, and long-term dollar stability.
THIS IS BITCOIN CYCLE BOTTOM ! 💀
Bitcoin cycle tops are built in comfort,euphoria and everyone believing the story is obvious.
This chart shows the opposite !
Monthly RSI back in the same reset zone that marked previous bottoms fear, disbelief, and broken confidence before the market proves the crowd wrong again.
People continue to look for the next “FTX moment”.
The highest probability for this to have occurred was six months after 10/10 (same time frame as 2022).
While, the majority are waiting for the Q4 low.
ALTSEASON WATCH #2
THE FIRST BREAKOUT IS HERE 💥
Altcoin Dominance has broken out of the multi year compression that buried the broad altcoin market since the 2021 cycle top.
This is not one coin pumping.
This is the broad altcoin market waking up against Bitcoin.
2017 started from this structure.
2021 started from this structure.
Now the same compression has broken again.
The question is no longer:
“Is there a breakout?”
There is.
The question now is:
can the market hold it,
build above it,
and turn it into real rotation?
ETH/BTC is the trigger.
Altcoin Dominance is the proof.
BTC dominance is the gatekeeper.
Altseason does not begin when the crowd believes.
It begins when structure breaks before attention returns.
The Altseason Taboo
Yes, probably the single most trigger-inducing word in crypto right now, one that nowadays sounds more like a myth or fantasy.
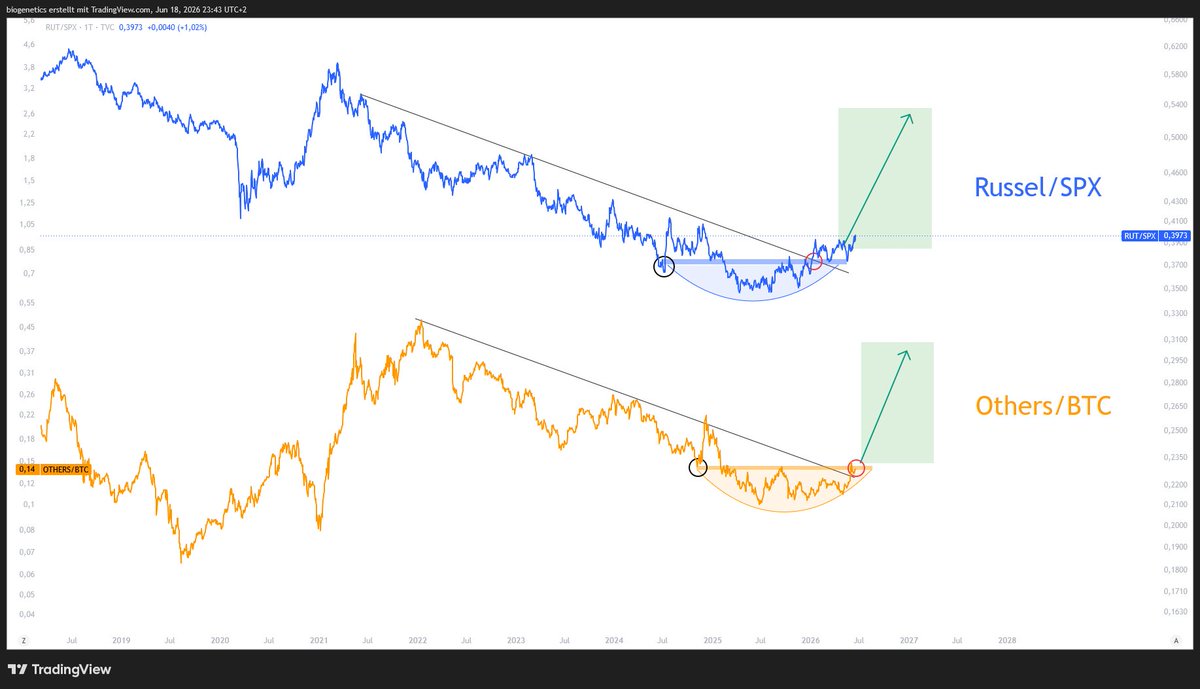
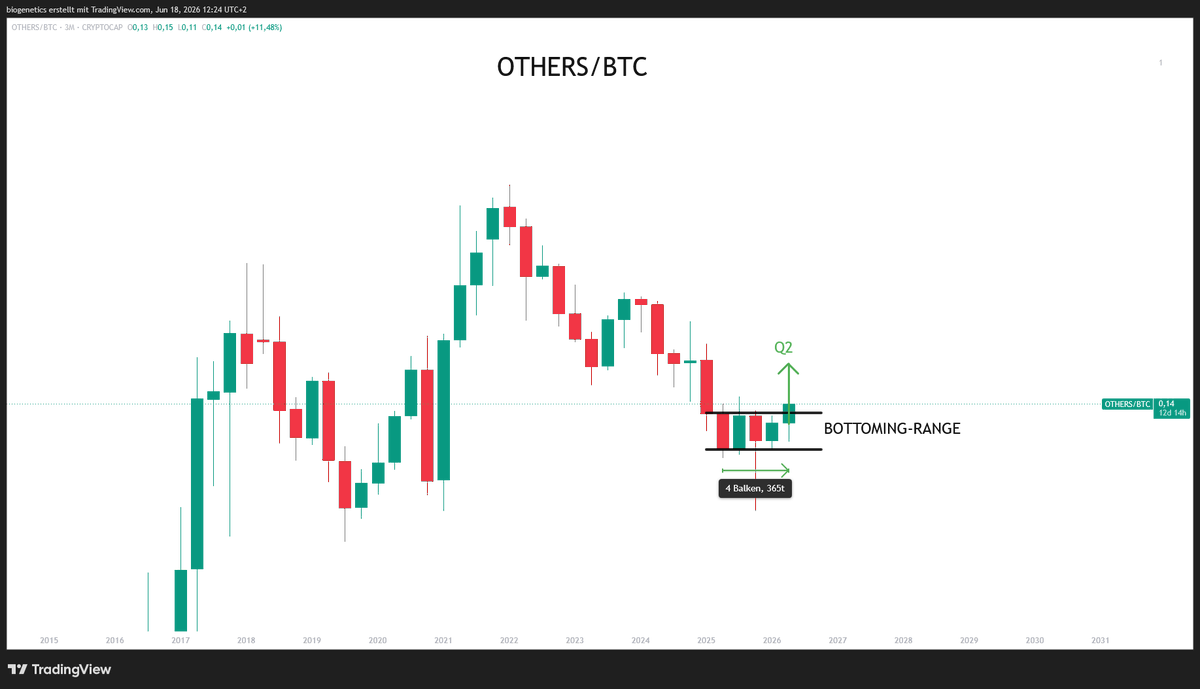
But if you allow me to define "altseason" technically using my momentum line on the $OTHERS / $BTC 2W chart, and call it an altseason when this chart trades above the momentum line, then it is crystal clear that we have not had one since 2021.
In fact, any developing runs came to a grinding halt exactly at the momentum line. Even the run prior to the October 10th liquidations ended exactly at the 1W momentum line.
What we have been noting for a while, though, is the formation of a macro accumulation range, marked by the first monthly Remora beam print. This has since been further validated by OTHERS/BTC forming a sideways consolidation range going back to March last year. We have even seen a classic "flush" of the range on October 10th.
At the moment, it has finally escaped the macro accumulation range, broken out of the downtrend line going back to 2022, and is currently sitting at the momentum line after wicking above it last week.
Considering how taboo the word has become, let's just say that, using the momentum line as a point of reference, a close above it would give us the first orange bar since 2021 and probably the first confirmation of the onset of an altcoin season, however long or short lived it may be....
#Bitcoin daily
Some only count a bullish rising 3 methods when the fifth candle closes above the candle body of the first, but some prefers it to close above the wick of the first.
Either way, this was a bullish candle that engulfed the last 3 bearish ones. Take that as it is.
Clean Copper/Gold breakout this week out of the Ichimoku cloud.
History tells me that I should not be bearish here.
You can trade the chop and be worried about the volatility short term.
I don't want to miss the big move up.
ALTCOIN RISK CURVE
ALTSEASON DOES NOT BEGIN IN USD
It begins against Bitcoin
This is TOTAL3 / BTC
the broad altcoin market,
excluding BTC, ETH and stablecoins,
measured against Bitcoin.
2017 did not start with euphoria.
2021 did not start with euphoria.
They started with compression,
disbelief, and a relative breakout against Bitcoin.
Now the same risk curve is compressing again. Not confirmation yet. The arrow is the question,
not the signal.
But this is the structure I watch before attention returns.
BTC dominance is the gatekeeper.
ETH/BTC is the confirmation layer.
TOTAL3/BTC is the broad risk curve.
Altseason is not one chart
Didn't think we'd get this divergence after 4 months, but here we are. Hopefully we translate it to 1W this week too.
In 2014 bottom the extreme RSI lows were 101 days apart
In 2022 they were 143 days apart
Atm we have 119 days