Parag Mehta. Student N learner of equity market.
Disclaimer: Charts posted only for educational purposes. Not buy||sell recommendations. Not SEBI registered.
LT Finance daily chart. Closed at all-time high of around 336 above its previous all-time high of around 330. Rounding bottom pattern formation of around 95 Rs. So next resistance may be at around 425 Rs.
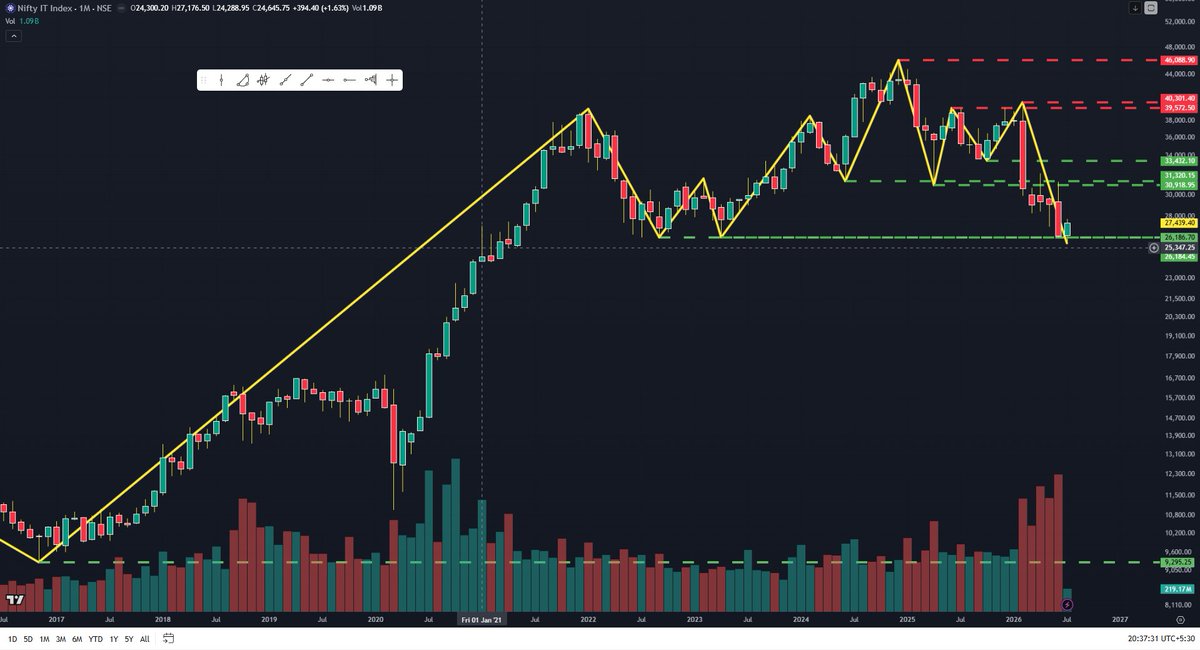
Nifty IT monthly chart. Month not complete. As of now has taken support of dow theory low from where it has reversed twice before. Hammer formation in process.
Reliance weekly chart. Weekly closing above dow theory support level of around 1290. 250 SMA (white line) support of around 1278. Has again taken support of 250 SMA on weekly closing basis just as multiple number of times in the past.
Reliance weekly chart. Dow theory support level of around 1291. 250 SMA (white line) support of around 1276. Multiple number of times has taken support of 250 SMA in the past.
Worried after last night’s US session & Gift Nifty?
First things first — Don’t panic. Don’t stress.
What was supposed to happen, happened.
Ab samjhte hain ki hua kya —
US Jobs Data
Expected: 85,000
Actual: 1,72,000
Literally double se bhi zyada
Ab isse hoga kya?
Fed rates high rakhega — rate cut ki umeed filhaal khatam. Borrowing expensive rahega. Markets ne react kiya as you saw.
BUT BUT BUT
FIFA World Cup 2026 US mein ho raha hai June 11 se. White House ka projection hai 1,85,000 temporary jobs sirf tournament ke liye. Hospitality, security, transport, event staff — sab abhi hire ho rahe hain.
Aur jobs data aaya exactly 1,72,000 🙃
Yeh structural economic strength hai ya World Cup ka seasonal bump?
July ke baad yeh sab jobs khatam. Fed shayad yeh miss kar gayi.
Sabse bada impact — IT Stocks
US firms IT budget cut karengi. Indian IT ke deals slow honge, revenue hit hoga. IT pe pressure valid hai — fundamentally.
Strong Dollar = Metals Down
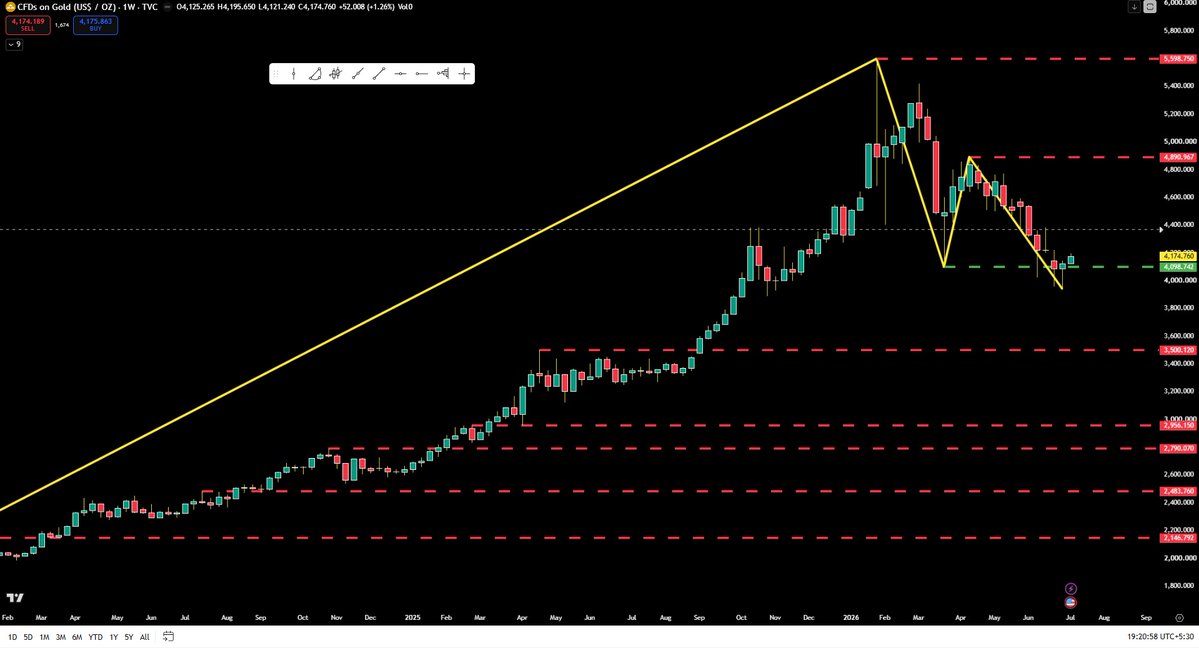
Fed holds → Dollar strong → Commodities weak. Isliye kal equity ke saath gold aur silver bhi gire. Confusing laga? Yehi reason tha.
Silver lining — Crude softening
Iran deal progress ho raha hai. Crude neeche aa raha hai — India ke liye genuinely positive.
Bottom line:
Sentiment hit hua hai. Structure nahi toota.
Yeh turbulence hai, breakdown nahi.
Jab tak koi fresh trigger na aaye — all is well.
Longs carry kiye the? Jo hona tha, ho gaya. Aage badho 💪
Shorts carry kiye the? Bete mauj kardi 🤣
#nifty #Banknifty #IndianStockMarket #DowJones #GiftNifty #Crash
Reliance monthly chart. Month yet to complete. Right now, below 50 SMA, but on monthly closing basis has taken support of 50 SMA multiple times. Dow theory support level of around 1340. Three-point trend line support of around 1232.
Reliance weekly chart. Dow theory support level of around 1291. 250 SMA (white line) support of around 1276. Multiple number of times has taken support of 250 SMA in the past.
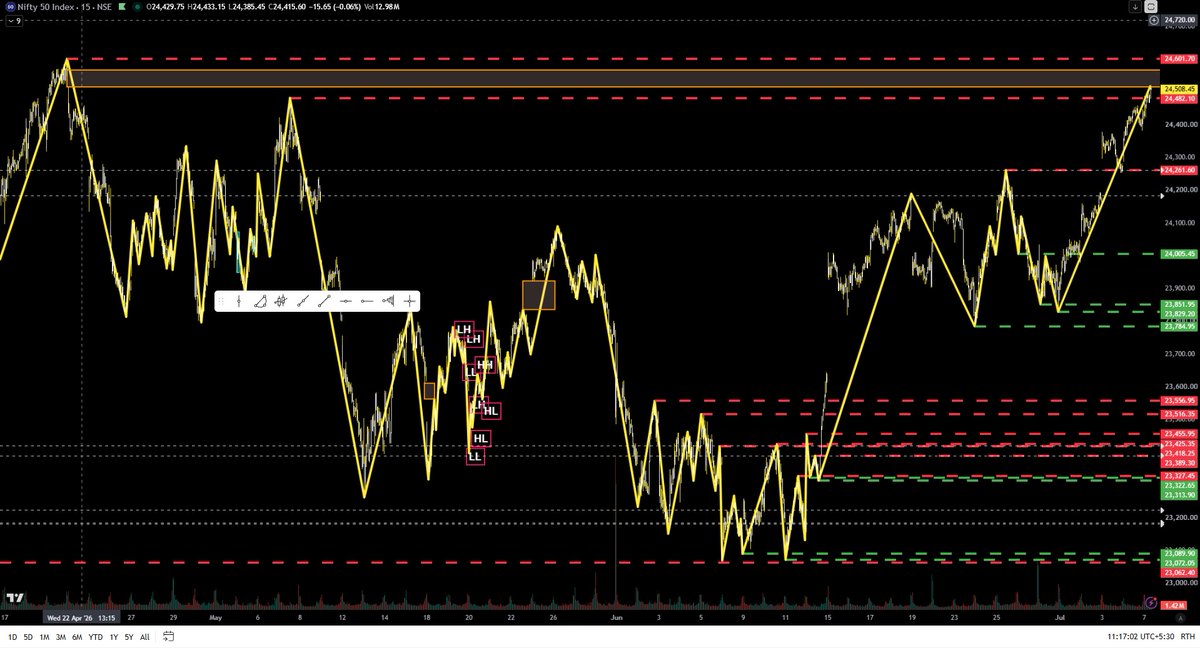
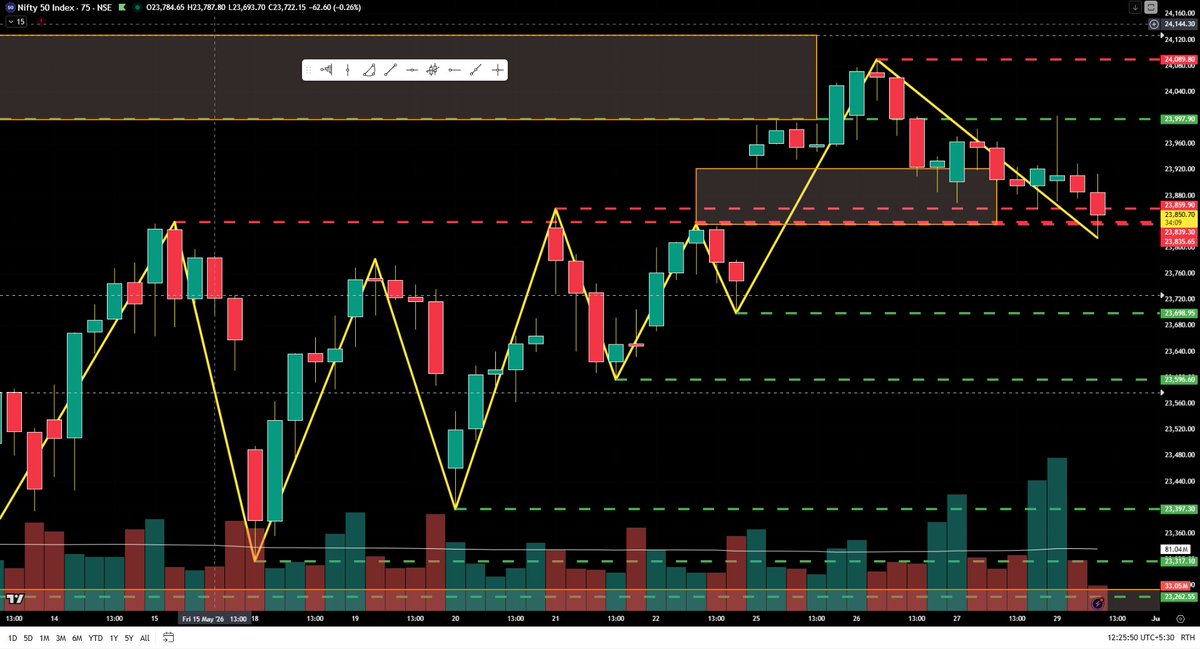
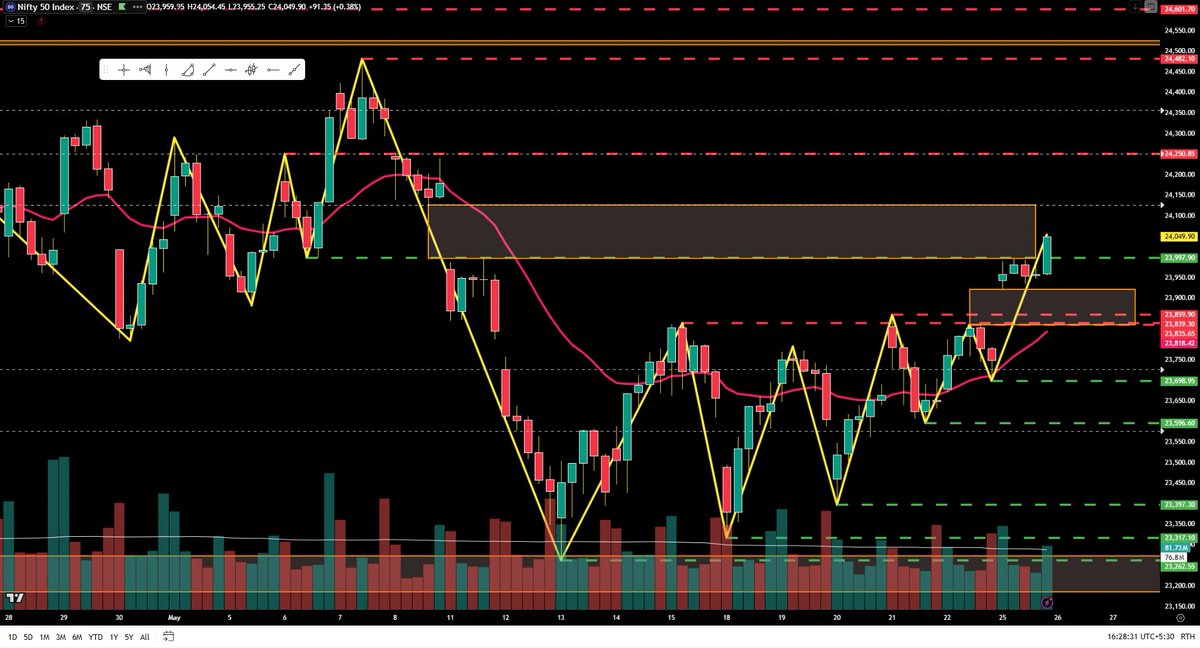
Nifty 15- and 75-minutes chart. Consolidated between 23923 and 23998 and gave a confirmed breakout. Right now, inside the gap area indicated in the 75 minutes chart. Next resistances are around 24251 and 24482
Received an informative video on Arattai today. Dr. Arun L Naik ji explains the Infinity Walk for Better Balance.
Simple and should be practiced by everyone, especially elders.
Share this with your parents and loved ones. Cheers to health.
#FI