I enjoy sharing my investment Journal and Insights in Traditional Chinese, English, and Korean.
Trade idea & records in X post;
Detailed insight in X article.
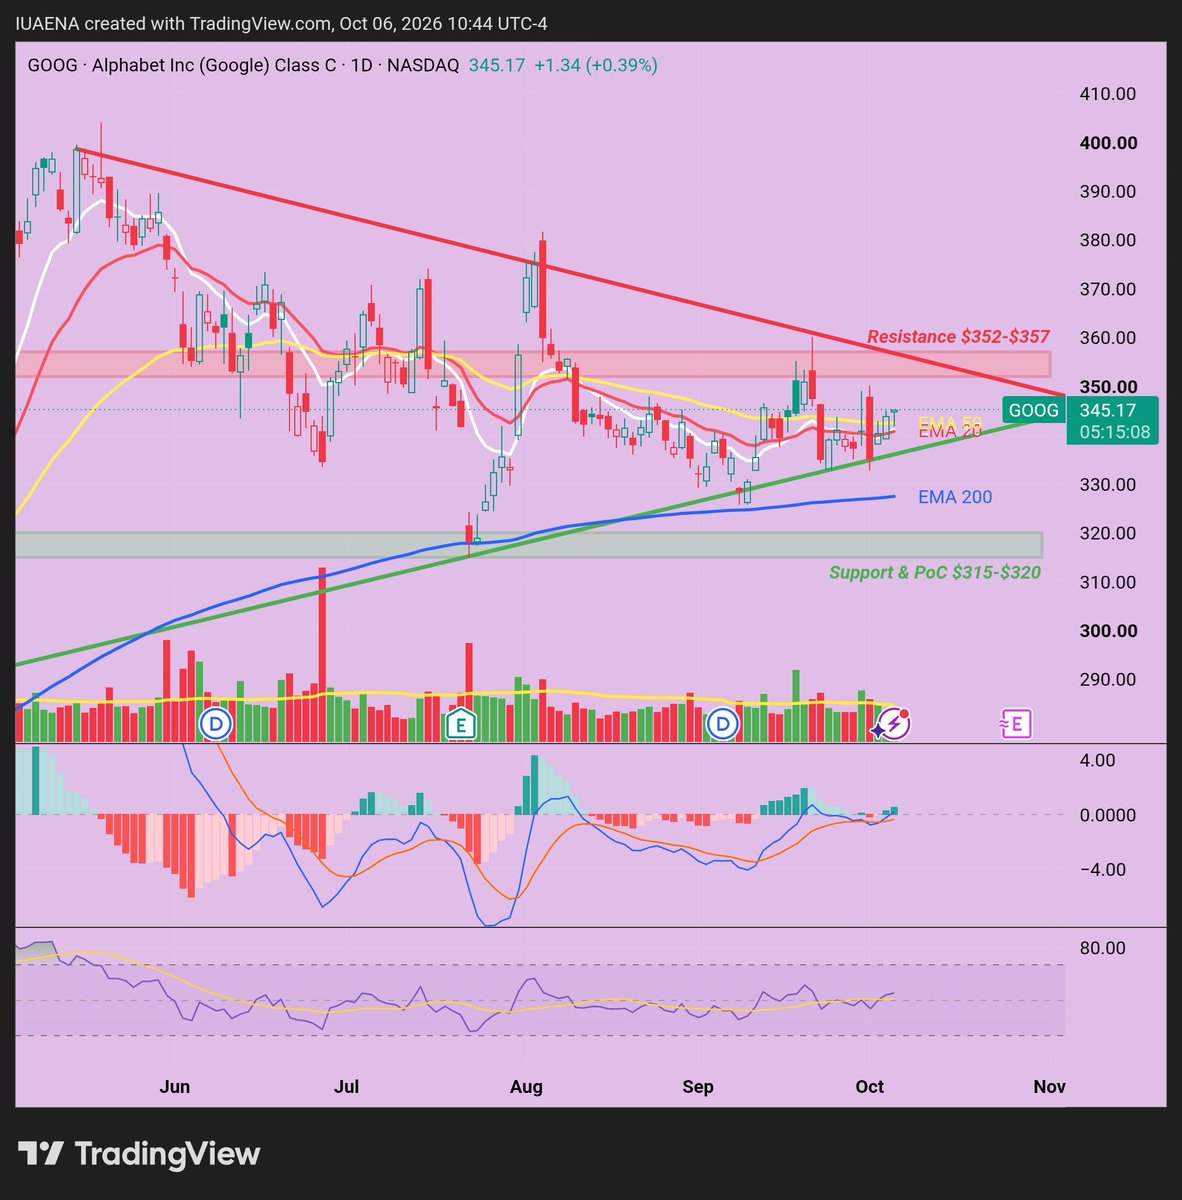
$GOOG $MSFT
從「跑分試用」走向「端到端業務執行」 🚀
生成式 AI 的競爭已正式從基於提示詞問答的實驗階段,直接轉向企業級的自主執行(Agentic AI)。在這個全新競技場上,單純的參數規模與實驗室基準測試評分已無法定義商業價值。真正的制勝關鍵在於:無縫整合進企業既有的傳統工作流程、嚴格管控總擁有成本(TCO),以及符合極為嚴苛的企業資訊安全標準。這才是當前真正推動企業估值的核心所在。
GEMINI 面對頂尖對手的核心護城河 🏆
面對 OpenAI(GPT 6 Astra、Dots)、Anthropic(Claude 系列)、微軟(Copilot)、Meta(MUSE)以及 xAI(Grok 4.1)等重量級對手,Gemini 的護城河並非建立在孤立的基準評分之上,而是取決於其全棧垂直架構與智能體操作系統(Agent OS)的能力:
🔹 與模型解耦的架構靈活性:
Gemini Enterprise 將智能體調度框架(agent harness)與底層模型進行解耦。它能動態將任務路由至內部的 Argon 和 Flash 等模型,同時無縫整合 Anthropic 等業界頂尖的第三方模型。企業無需在基礎模型每次升級時重寫整個業務工作流程,徹底消除了平台遷移風險與供應商綁定(vendor lock-in)。
🔹 深度跨系統與跨環境滲透能力:
與受限於單一對話視窗或封閉花園的模型不同,Gemini 能在行動端、桌面端及命令列介面(CLI)間流暢運作。它原生滲透至 Google Workspace、Microsoft 365、Slack 及 ServiceNow,徹底解決了跨工作場所工具帶來的上下文碎片化夢魘。
🔹 具備加密身分的企業級安全性:
智能體不再依附於個別員工的登入帳號,而是獲配專屬的獨立數位憑證。這讓稽核日誌與存取權限控制變得清晰明瞭。結合沙盒隔離與 AI 防火牆技術,能有效抵禦提示詞注入(prompt injection)及未經授權的數據存取,完全符合受嚴格監管行業的要求。
🔹 打破 Token 成本悖論:
複雜的工作流程極易消耗超過 10 萬個 Token。Gemini 透過「智能路由」(Smart Routing)解決了這個難題:先由輕量級模型啟動,僅在關鍵執行步驟自動升級調用高階模型——以約三分之一的成本達到前沿旗艦級效能。在連接企業知識目錄(Knowledge Catalog)後,常規報告查詢消耗零 LLM Token,徹底杜絕了重複計費。
為何基準測試不再能定義企業價值 📉
🔹 「酷炫展示(Cool Demo)」與「日常營運」之間的鴻溝:
基準測試衡量的是封閉數據集上的單次靜態回答;真實商業環境則運行於動態變數與長上下文之上。企業需要的是每一次都穩定可靠的交付,而非僅僅是一句令人驚豔的單行回覆。
🔹 災難性的交付負面代價(近乎零的容錯率):
在企業營運中,98% 的準確率遠遠不夠。剩下 2% 的出錯率——無論是一次報價錯誤、洩露客戶個人身分識別資訊(PII),或是簽核了錯誤的合約條款——其代價足以抹煞先前數百次正確回答所累積的信任。
🔹 基準測試忽視了總擁有成本(TCO):
低廉的 API 標價並不等於具備成本效益。如果低階模型因誤解限制條件而導致工作流程被迫重跑,抑或缺乏完善的審計機制導致人工審查工時暴增,企業的整體支出(算力、儲存、頻寬及人力成本)將會呈爆炸式增長。
🔹 無法解析企業的「暗數據(Dark Data)」:
公開基準測試無法檢驗模型對企業內部專有術語或客製化 KPI 指標的理解能力。如果模型無法錨定內部知識目錄,就算代碼生成速度再快,產出的也只是一份排版精美卻滿是錯誤數據的報告。
誰能以最快速度且最高利潤率將 AI 變現? 💰
各方陣營面臨的商業瓶頸:
🔹純模型實驗室(OpenAI、Anthropic、xAI):
受前沿模型天文數字般的訓練資本支出(Capex)及推理電力成本雙重擠壓,其毛利率在持續的 API 價格戰中承受巨大壓力。由於缺乏原生企業端應用入口與雲端儲存基礎設施,客戶獲取高度依賴第三方通路分發,導致自由現��流(FCF)轉換率偏低。
🔹消費級社交平台(Meta):
主要利用開源生態系統來優化內部的廣告投放與內容推薦演算法。這屬於內部效率的優化,並未直接切入高利潤率的企業級軟體訂閱市場。
變現最快、獲利最豐的贏家:Alphabet(Google)與微軟👑👑
核心結論:同時擁有雲端基礎設施與日常辦公工作場景的超大規模雲端服務商(Hyperscalers),能以最快速度變現並享有最高的利潤上限。
而在兩者之中,Alphabet 在中長期擁有更具優勢的淨利率彈性與更深的護城河。
🔹 強大的生態鎖定與極其高昂的轉換成本:
一旦企業建立起客製化的技能(Skills)、累積了四層記憶架構,並深度整合內部數據湖與數據倉儲,遷移至其他平台的代價將高到令人卻步。這確保了頂級的客戶留存率與每用戶平均收入(ARPU)的持續擴大。
🔹 從晶片到底層應用的全棧利潤防禦:
相較於微軟高度仰賴外部模型授權(OpenAI)與商用晶片(Nvidia),Google 掌控了從自主研發的 TPU 集群、前沿模型(Argon)到全球海底光纖網絡的一切環節。這種高度垂直整合大幅壓低了每次推理的營運支出(Opex),即使面對巨額資本支出,依然能維持充沛的自由現金流(FCF)。
🔹 經過驗證且具備規模化效應的變現引擎:
《財富》100 強企業中已有近 90% 採用 Gemini Enterprise,更有近 500 家企業巨頭每年消耗超過 1 兆個 Token。Google 的三層變現架構——按席位訂閱、算力使用費以及數據倉儲附加費——正以創紀錄的速度將技術突破直接轉化為實際的底線淨利潤。
FROM BENCHMARK PLAYGROUNDS TO END-TO-END BUSINESS EXECUTION 🚀
The generative AI race has officially shifted from the experimental phase of prompt-based Q&A straight into enterprise-grade autonomous execution (Agentic AI). In this new arena, raw parameter counts and lab benchmark scores no longer define commercial value. The real game-changer? Seamless integration into legacy corporate workflows, tight control over Total Cost of Ownership (TCO), and meeting ruthless enterprise infosec standards. That is what truly drives enterprise valuation today.
GEMINI’S CORE MOAT AGAINST TOP-TIER RIVALS 🏆 Facing off against heavyweights like OpenAI (GPT 6 Astra, Dots), Anthropic (Claude series), Microsoft (Copilot), Meta (MUSE), and xAI (Grok 4.1), Gemini’s moat isn't built on isolated benchmark scores. It comes down to its full-stack vertical architecture and agent operating system capabilities:
🔹 Model-Agnostic Architectural Flexibility: Gemini Enterprise decouples the agent harness from the underlying model. It dynamically routes tasks to in-house models like Argon and Flash, while seamlessly integrating best-in-class third-party models like Anthropic. Enterprises don't have to rewrite their entire business workflow every time a base model upgrades, wiping out re-platforming risks and vendor lock-in.
🔹 Deep Cross-System & Cross-Environment Penetration: Unlike models trapped inside a single chat window or walled garden, Gemini operates smoothly across mobile, desktop, and CLI. It natively penetrates Google Workspace, Microsoft 365, Slack, and ServiceNow, solving the fragmented context nightmare across different workplace tools.
🔹 Enterprise-Grade Security with Cryptographic Identity: Instead of piggybacking on individual employee logins, every agent is provisioned with its own independent digital credential. This makes audit logging and access control clean and straightforward. Combined with sandbox isolation and AI firewalls, it shuts down prompt injections and unauthorized data access, fully complying with strictly regulated industries.
🔹 Breaking the Token Cost Paradox: Complex workflows can easily burn through 100k+ tokens. Gemini solves this with Smart Routing: start with lightweight models and automatically level up only for critical execution steps—hitting frontier performance at roughly a third of the cost. Hooked up to an enterprise Knowledge Catalog, routine reporting queries consume zero LLM tokens, cutting out duplicate billing entirely.
WHY BENCHMARKS NO LONGER DEFINE ENTERPRISE VALUE 📉
🔹 The Chasm Between "Cool Demo" and "Daily Operations": Benchmarks measure one-off static answers on closed datasets. Real business runs on dynamic variables and extended context. Enterprises need reliable delivery every single time, not just an impressive one-liner.
🔹 Devastating Negative Delivery Costs (Near-Zero Fault Tolerance): In enterprise operations, a 98% accuracy rate isn't enough. That remaining 2% failure rate—whether an incorrect quote, leaked customer PII, or signing off on the wrong contract terms—costs enough to erase the trust built over hundreds of correct answers.
🔹 Benchmarks Ignore Total Cost of Ownership (TCO): A cheap API sticker price doesn't make it cost-effective. If a lower-tier model misunderstands constraints and forces workflows to rerun, or lacks proper auditability and blows up manual review hours, overall corporate spend (compute, storage, bandwidth, and human overhead) explodes.
🔹 Inability to Parse Enterprise "Dark Data": Public benchmarks cannot test how well a model grasps proprietary internal jargon or custom KPI metrics. If a model can't anchor to an internal Knowledge Catalog, lightning-fast code generation just yields beautifully formatted reports full of wrong numbers.
WHO MONETIZES AI FASTEST AND WITH THE HIGHEST MARGINS? 💰
Commercial Bottlenecks Across the Field:
🔹Pure-Play Model Labs (OpenAI, Anthropic, xAI): Squeezed by astronomical frontier training Capex and inference power bills, their gross margins face brutal pressure in the ongoing API price war. Lacking native enterprise front-ends and cloud storage infra, customer acquisition relies heavily on third-party distribution, resulting in low Free Cash Flow (FCF) conversion.
🔹Consumer Social Platforms (Meta):
Mainly leveraging open-source ecosystems to optimize internal ad targeting and content recommendation algorithms. This is internal efficiency optimization—it doesn't directly tap into the high-margin enterprise software subscription pool.
The Fastest, Most Profitable Winners: Alphabet (Google) & Microsoft 👑👑
Conclusion: Hyperscalers owning both cloud infrastructure and everyday workplace surfaces monetize fastest with the highest margin ceilings. Between them, Alphabet holds superior mid-to-long-term net margin elasticity and a deeper moat.
🔹 Intense Ecosystem Lock-In & Astronomical Switching Costs: Once enterprises build custom Skills, accumulate 4-tier memory architectures, and deeply integrate internal data lakes and warehouses, migrating away becomes prohibitively painful. This secures top-tier retention and continuous ARPU expansion.
🔹 Silicon-to-Application Full-Stack Margin Defense: While Microsoft leans heavily on external model licenses (OpenAI) and merchant silicon (Nvidia), Google controls everything from in-house TPU clusters and frontier models (Argon) to global subsea fiber networks. This full vertical integration crushes per-inference Opex, preserving robust FCF even against massive Capex outlays.
🔹 Proven, Scaled Monetization Engines: Nearly 90% of the Fortune 100 already run Gemini Enterprise, with nearly 500 enterprise giants burning over 1 trillion tokens annually. Google’s 3-tier monetization engine—per-seat subscriptions, compute usage fees, and data warehouse surcharges—converts tech breakthroughs directly into bottom-line profits at record speed.
$WOLF
I just bought a little bit position of WOLF to try at $34.
重大事件:美國國防部(DoD)與聯邦政府今晨正式宣布,已向碳化矽(SiC)龍頭 Wolfspeed 提供高達 15 億美元 的 30 年期長期有條件貸款承諾,用於加速擴大美國本土軍工與商業功率元件晶圓產能,直接化解短期債務違約疑慮,刺激股價盤前狂飆 +16.6%。
https://t.co/e4ff3uCgSX
$WOLF
I just bought a little bit position of WOLF to try at $34.
重大事件:美國國防部(DoD)與聯邦政府今晨正式宣布,已向碳化矽(SiC)龍頭 Wolfspeed 提供高達 15 億美元 的 30 年期長期有條件貸款承諾,用於加速擴大美國本土軍工與商業功率元件晶圓產能,直接化解短期債務違約疑慮,刺激股價盤前狂飆 +16.6%���
https://t.co/e4ff3uCgSX
$CAT
日線圖 (方向與關鍵)
方向:築底趨升;關鍵:$864-$882為阻力及$773-$798為支撐。
4小時圖(結構高低點)
結構:形成了上升通道及一浪高於一浪
1小時圖(值得觀察區)
值得觀察區:Fair Value Gap ($829.45 - $838.4) 於2026-10-05開市時的第一支 1小時 candle被觸及後便迅速反彈。
15分鐘圖(進場條件現)
等待進場加倉位置為$838-$842,理由是該處為15分鐘圖EMA 200上方,以及填充FVG後重新反彈並突破的位置。
Daily Chart (Direction & Key Levels)
Direction: Bottoming out and trending upward; Key Levels: $864–$882 serves as resistance, and $773–$798 serves as support.
4-Hour Chart (Structural Highs & Lows)
Structure: An ascending channel has formed, establishing higher highs and higher lows.
1-Hour Chart (Areas of Interest)
Area of Interest: The Fair Value Gap ($829.45–$838.4) was tested by the first 1-hour candle at the market open on 2026-10-05 and subsequently rebounded swiftly.
15-Minute Chart (Entry Conditions Present)
The pending entry level to add to the position is $838–$842, on the grounds that this area lies above the 15-minute EMA 200 and represents the breakout level following the rebound after filling the FVG.
Daily Chart (Direction & Key Levels)
Direction: 바닥을 다지고 상승 추세로 전환 중; Key Levels: $864–$882 구간이 저항선으로 작용하며, $773–$798 구간이 지지선 역할을 함.
4-Hour Chart (Structural Highs & Lows)
Structure: 상승 채널이 형성되었으며, 고점과 저점을 지속적으로 높여가는 형태(higher highs & higher lows)를 구축함.
1-Hour Chart (Areas of Interest)
Area of Interest: 페어 밸류 갭(Fair Value Gap, $829.45–$838.4) 구간은 2026-10-05 장 시작 시 첫 1시간봉에서 테스트된 후 빠르게 반등함.
15-Minute Chart (Entry Conditions Present)
추가 매수 대기 진�� 구간은 $838–$842이며, 이는 해당 영역이 15분봉 EMA 200 위에 위치하고 FVG를 채운 뒤 반등하여 나타난 돌파 구간이라는 점을 근거로 함.
$CAT
日線圖 (方向與關鍵)
方向:築底趨升;關鍵:$864-$882為阻力及$773-$798為支撐。
4小時圖(結構高低點)
結構:形成了上升通道及一浪高於一浪
1小時圖(值得觀察區)
值得觀察區:Fair Value Gap ($829.45 - $838.4) 於2026-10-05開市時的第一支 1小時 candle被觸及後便迅速反彈。
15分鐘圖(進場條件現)
等待進場加倉位置為$838-$842,理由是該處為15分鐘圖EMA 200上方,以及填充FVG後重新反彈並突破的位置。
Daily Chart (Direction & Key Levels)
Direction: Bottoming out and trending upward; Key Levels: $864–$882 serves as resistance, and $773–$798 serves as support.
4-Hour Chart (Structural Highs & Lows)
Structure: An ascending channel has formed, establishing higher highs and higher lows.
1-Hour Chart (Areas of Interest)
Area of Interest: The Fair Value Gap ($829.45–$838.4) was tested by the first 1-hour candle at the market open on 2026-10-05 and subsequently rebounded swiftly.
15-Minute Chart (Entry Conditions Present)
The pending entry level to add to the position is $838–$842, on the grounds that this area lies above the 15-minute EMA 200 and represents the breakout level following the rebound after filling the FVG.
Daily Chart (Direction & Key Levels)
Direction: 바닥을 다지고 상승 추세로 전환 중; Key Levels: $864–$882 구간이 저항선으로 작용하며, $773–$798 구간이 지지선 역할을 함.
4-Hour Chart (Structural Highs & Lows)
Structure: 상승 채널이 형성되었으며, 고점과 저점을 지속적으로 높여가는 형태(higher highs & higher lows)를 구축함.
1-Hour Chart (Areas of Interest)
Area of Interest: 페어 밸류 갭(Fair Value Gap, $829.45–$838.4) 구간은 2026-10-05 장 시작 시 첫 1시간봉에서 테스트된 후 빠르게 반등함.
15-Minute Chart (Entry Conditions Present)
추가 매수 대기 진입 구간은 $838–$842이며, 이는 해당 영역이 15분봉 EMA 200 ���에 위치하고 FVG를 채운 뒤 반등하여 나타난 돌파 구간이라는 점을 근거로 함.
$TSM
I decide to close TSM to take profit at $480.11
Because RSI is overbought now.
I will wait for another swing trade opportunity, when it pulls back to $461
$CEG
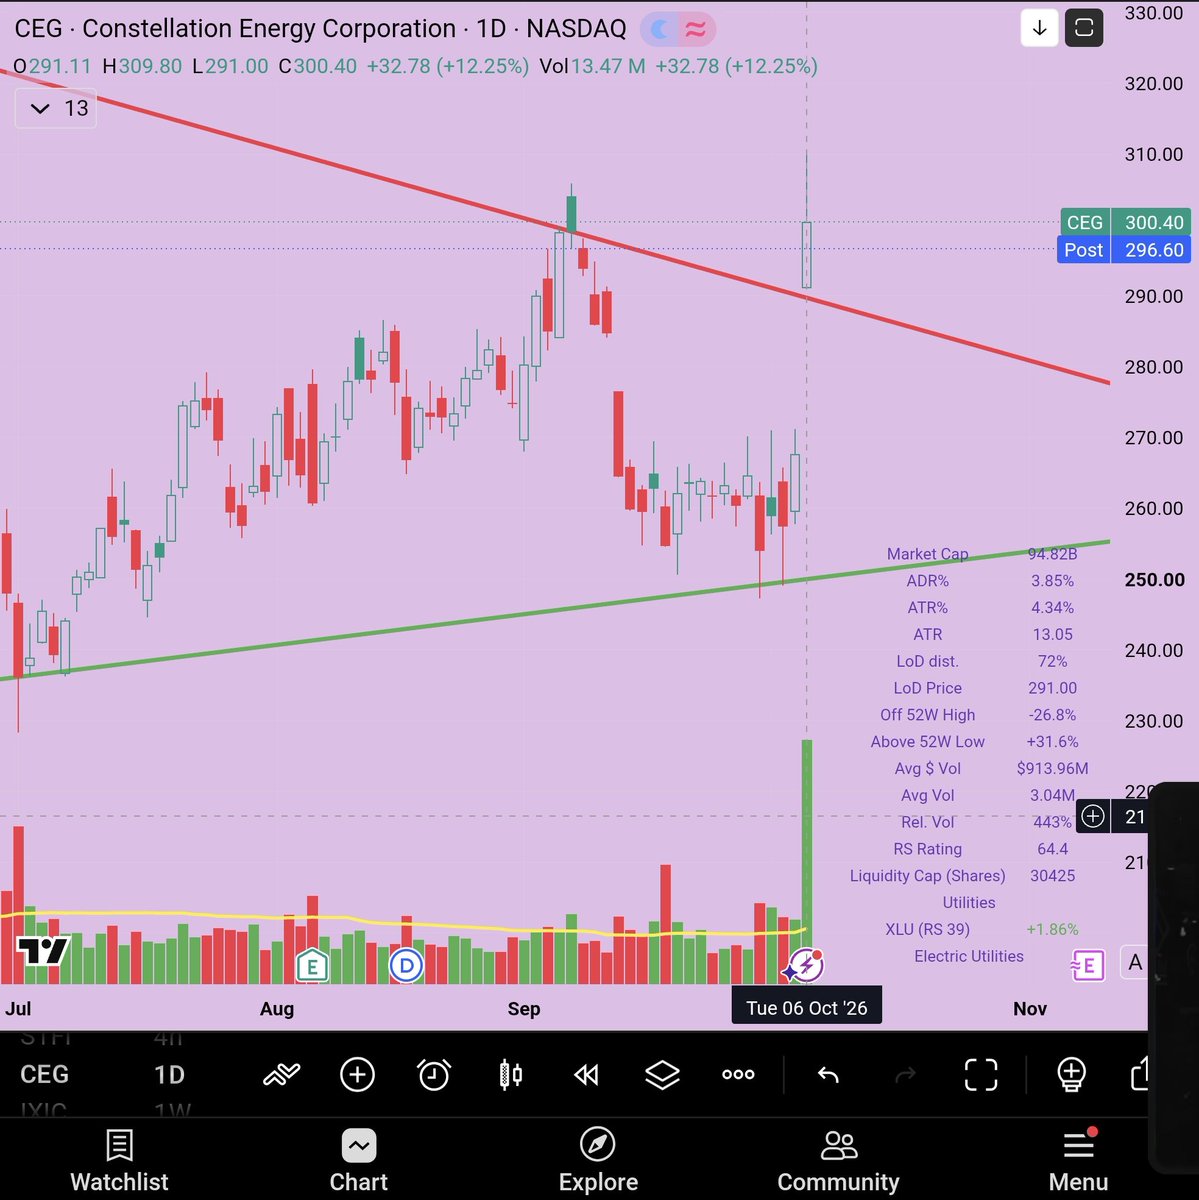
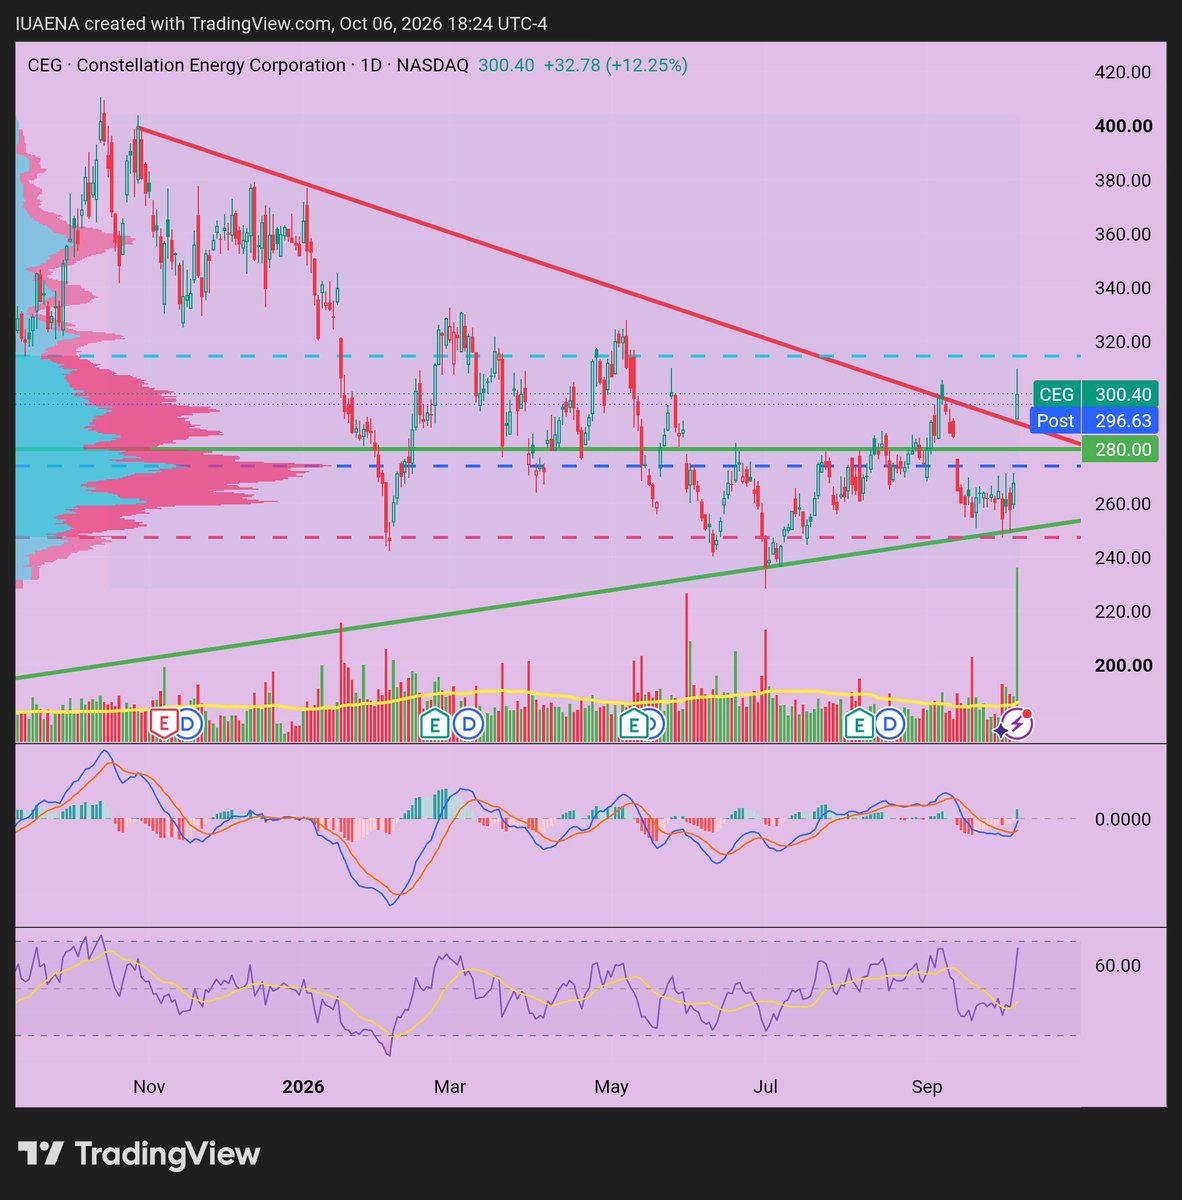
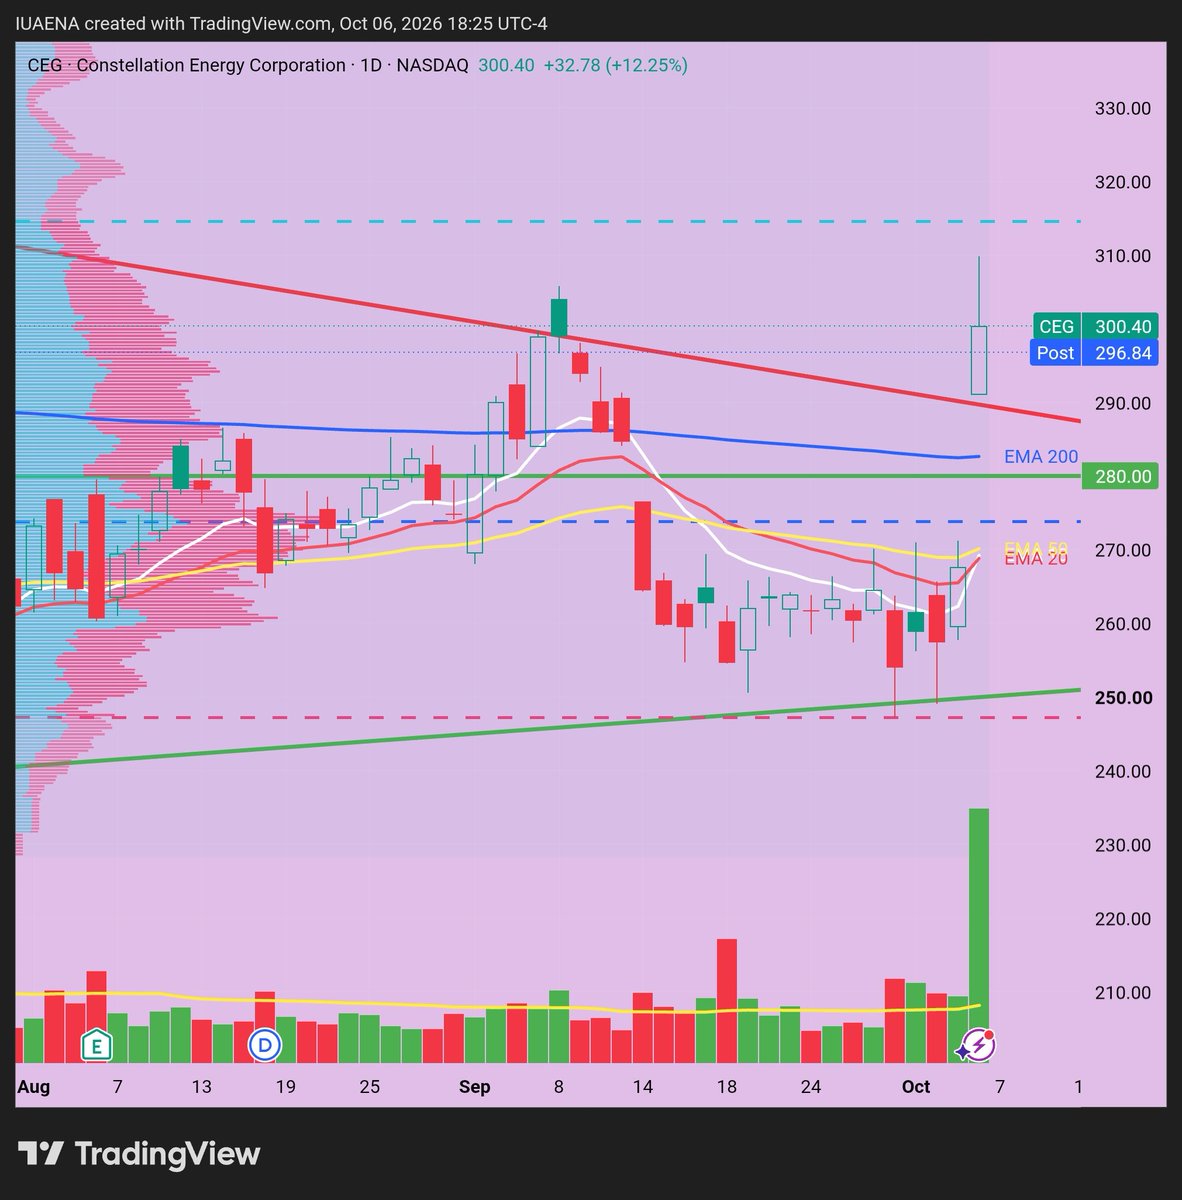
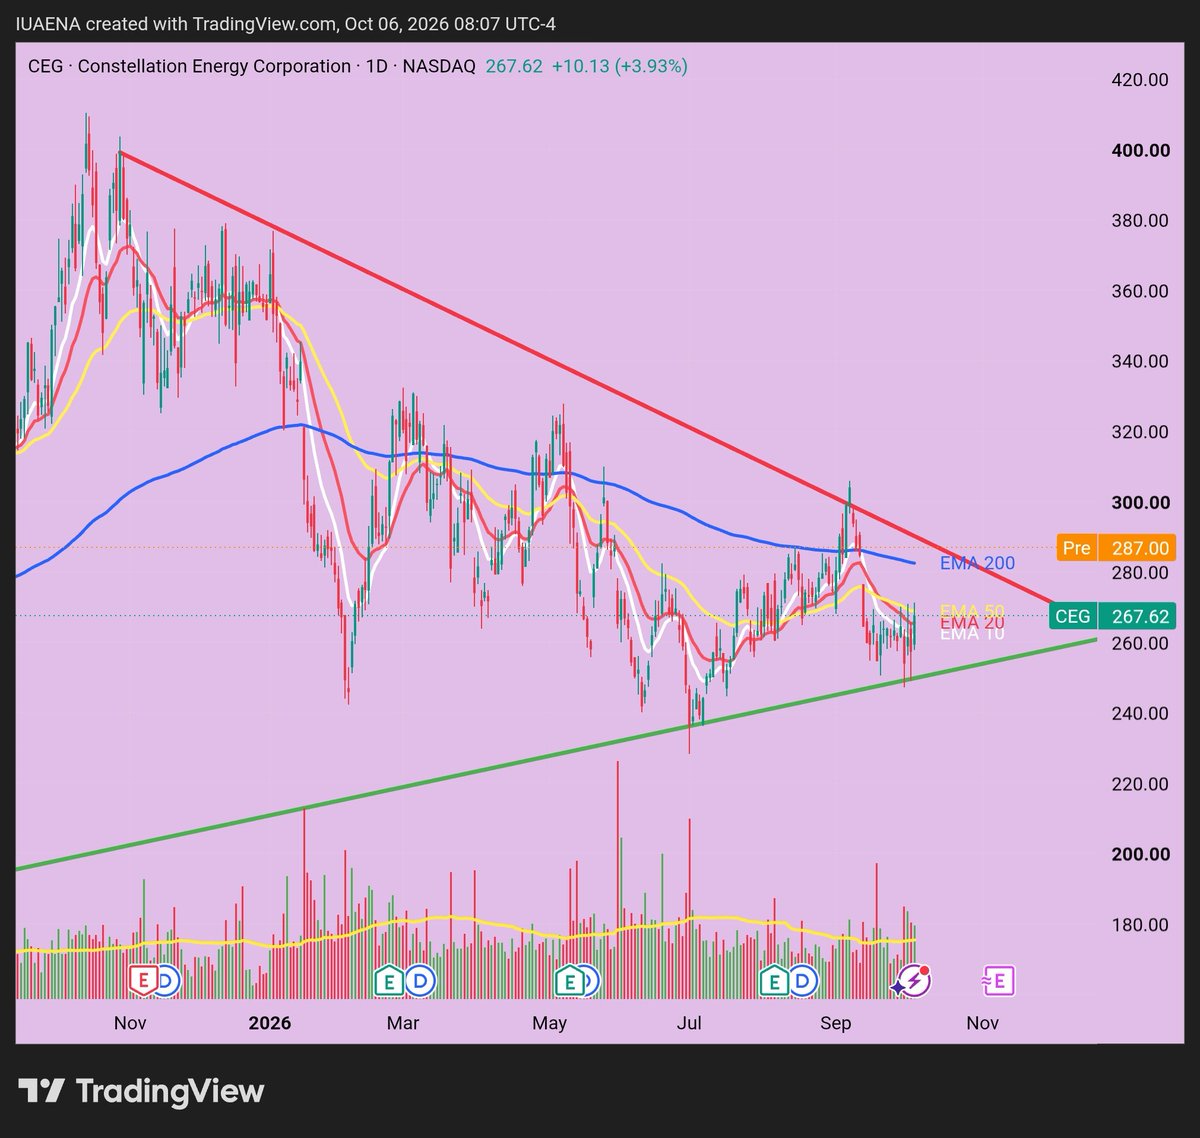
CEG 的平均成交量為 304 萬股,但昨日(2026-10-06)收盤時成交量大幅放大至 4.43 倍(達 1,347 萬股)📈
檢視 4 小時圖,買方顯然佔據主導地位,實力大約是賣方的 2 倍。收盤價成功站穩在 2026-09-04 的前期高位之上,並突破了自 2025 年 11 月以來一直壓制股價的阻力位,打開了一定的上行空間。
對於這次突破,我態度偏向審慎看好。話雖如此,它未能在收盤時維持完整的光頭光腳大陽線(Marubozu),並在 K 線上方留下了上影線。因此,我僅在收盤前以 300 美元的價格建了半倉底倉來試水溫 🎯
CEG avg volume sits at 3.04M, but yesterday (2026-10-06) it closed on massive 4.43x volume (13.47M) 📈
Checking the 4-hour chart, buyers were clearly running the show, outmatching sellers roughly 2:1. The closing price managed to hold above the previous high from 2026-09-04 and clear some room past the resistance level that's been capping it since November 2025.
I'm leaning slightly bullish on this breakout. That said, it didn't hold a clean green marubozu straight through the bell and left an upper wick on the candle. Because of that, I only took a starter half-position at $300 right before the close to test the waters 🎯
CEG 평균 거래량은 3.04M 수준인데, 어제(2026-10-06) 무려 4.43배에 달하는 13.47M 거래량이 터지면서 마감했네요 📈
4시간 봉 차트를 뜯어보면 매수세가 약 2:1 비율로 시장을 완전히 주도하는 흐름이었습니다. 종가 기준으로 2026-09-04 전고점을 뚫고 지켜줬고, 2025년 11월부터 이어져 ��� 저항선에서도 살짝 거리를 벌리며 위로 안착했습니다.
이번 돌파 흐름을 일단은 긍정적으로 보고 있습니다. 다만 장 시작부터 끝까지 밀어붙이지 못하고 윗꼬리를 길게 남긴 점이 조금 걸리네요. 그래서 무리하지 않고 종가에 $300 선에서 절반 비중만 정찰병으로 담아봤습니다 🎯
$CEG
Constellation, Google confirm nuclear energy deal tied to 890 MW of new PJM capacity
I would see if $CEG could stand above on resistance breaking out ($290) or not. If not, pulling back to $280 would be attractive.
$TSM
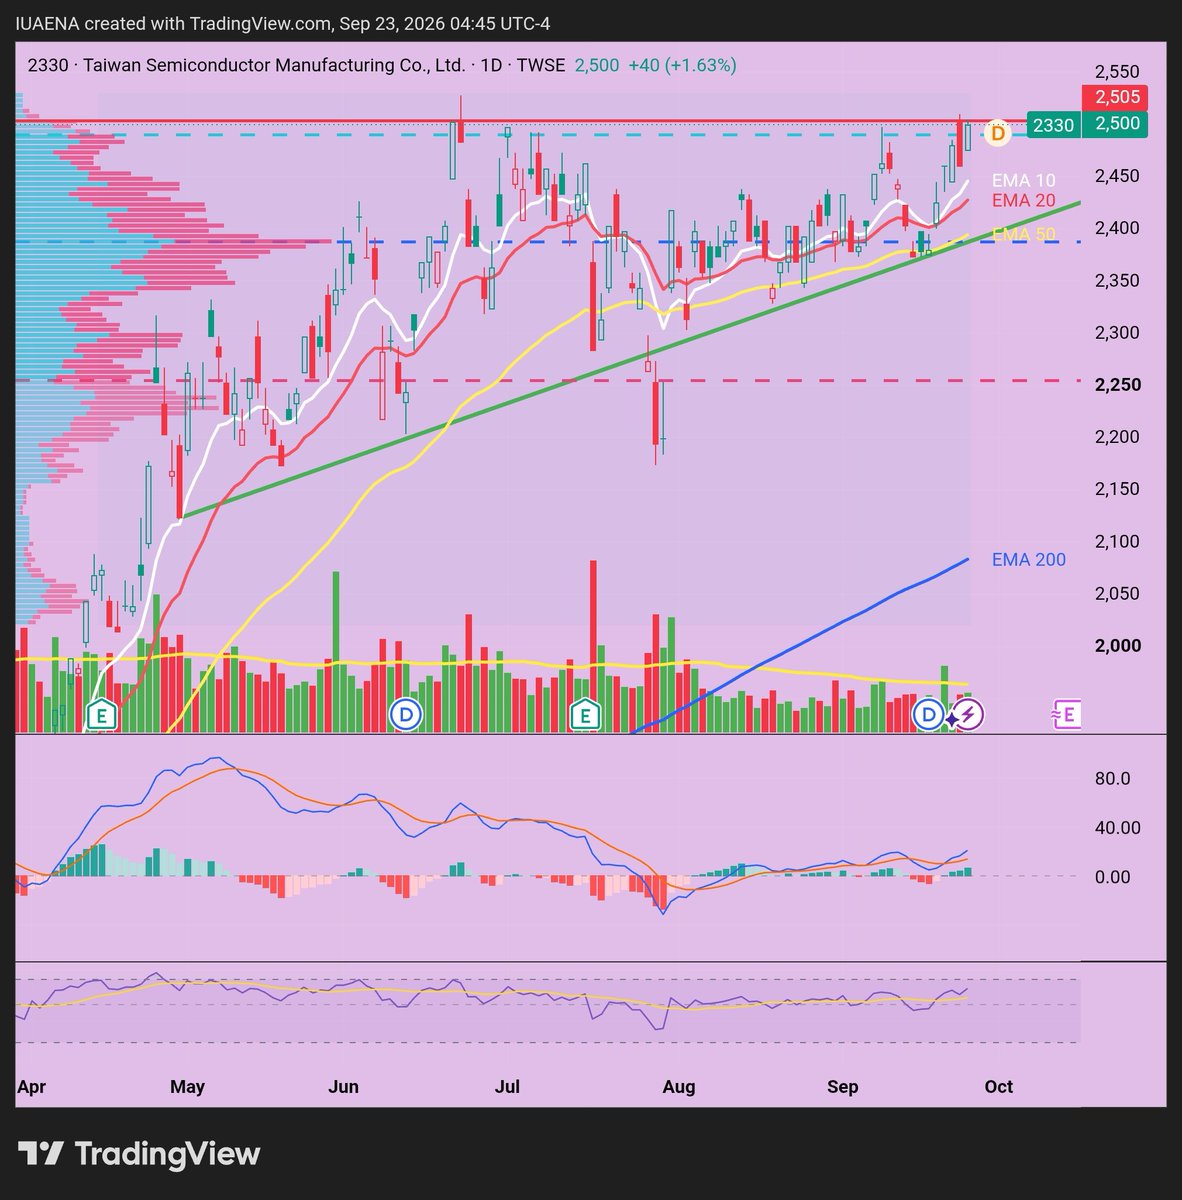
比較 $TSM 與 2330 📊
在美上市的 $TSM 先前資金被 SK 海力士抽走,ADR 溢價已被大幅壓縮。
與此同時,台積電在台上市的股票(2330)今天再度逼近歷史新高。📈
隨著台股率先突破並確認多頭趨勢,$TSM 是否正蓄勢待發,迎來補漲行情並修復溢價?
決定在 $449 建立小額底倉以觀察價格走勢。👀
Comparing $TSM vs 2330 📊
US-listed $TSM had capital sucked away by SK Hynix previously, and the ADR premium has been compressed quite a bit.
Meanwhile, TSMC’s Taiwan-listed shares (2330) pushed right back near their all-time highs today. 📈
With the Taiwan stock leading the breakout and confirming the bullish trend, is $TSM gearing up for a catch-up rally and premium restoration?
Decided to initiate a small starter position at $449 to observe the price action. 👀
미국장 $TSM vs 대만 본주 2330 비교 📊
미국 증시 $TSM은 그동안 SK하이닉스로 자금이 쏠리면서 수급이 빠져나갔고, 이로 인해 ADR 프리미엄도 상당히 많이 깎인 상태.
반면 대만 본주인 TSMC 2330은 오늘 역대 최고점 부근까지 바짝 다시 올라왔습니다. 📈
대만 본주가 먼저 전고점을 뚫어내며 확실한 상승 추세를 잡았는데, 과연 $TSM도 키맞추기 반등과 함께 프리미엄 복원에 나설 수 있을까요?
일단 $449에서 정찰병(소액 포지션) 하나 띄워두고 흐름 지켜보기로 했습니다. 👀
$MSFT
$495 - $515 的PoC (Point of Control) 區域開始由阻力漫漫演變成新的支撐位📊🔄
The $495 – $515 PoC (Point of Control) zone is gradually flipping from resistance into new support 📊🔄
$495 – $515 PoC (Point of Control) 매물대 구간이 저항에서 새로운 지지선으로 서서히 전환되는 중이네요 📊🔄
$CEG
Constellation, Google confirm nuclear energy deal tied to 890 MW of new PJM capacity
I would see if $CEG could stand above on resistance breaking out ($290) or not. If not, pulling back to $280 would be attractive.
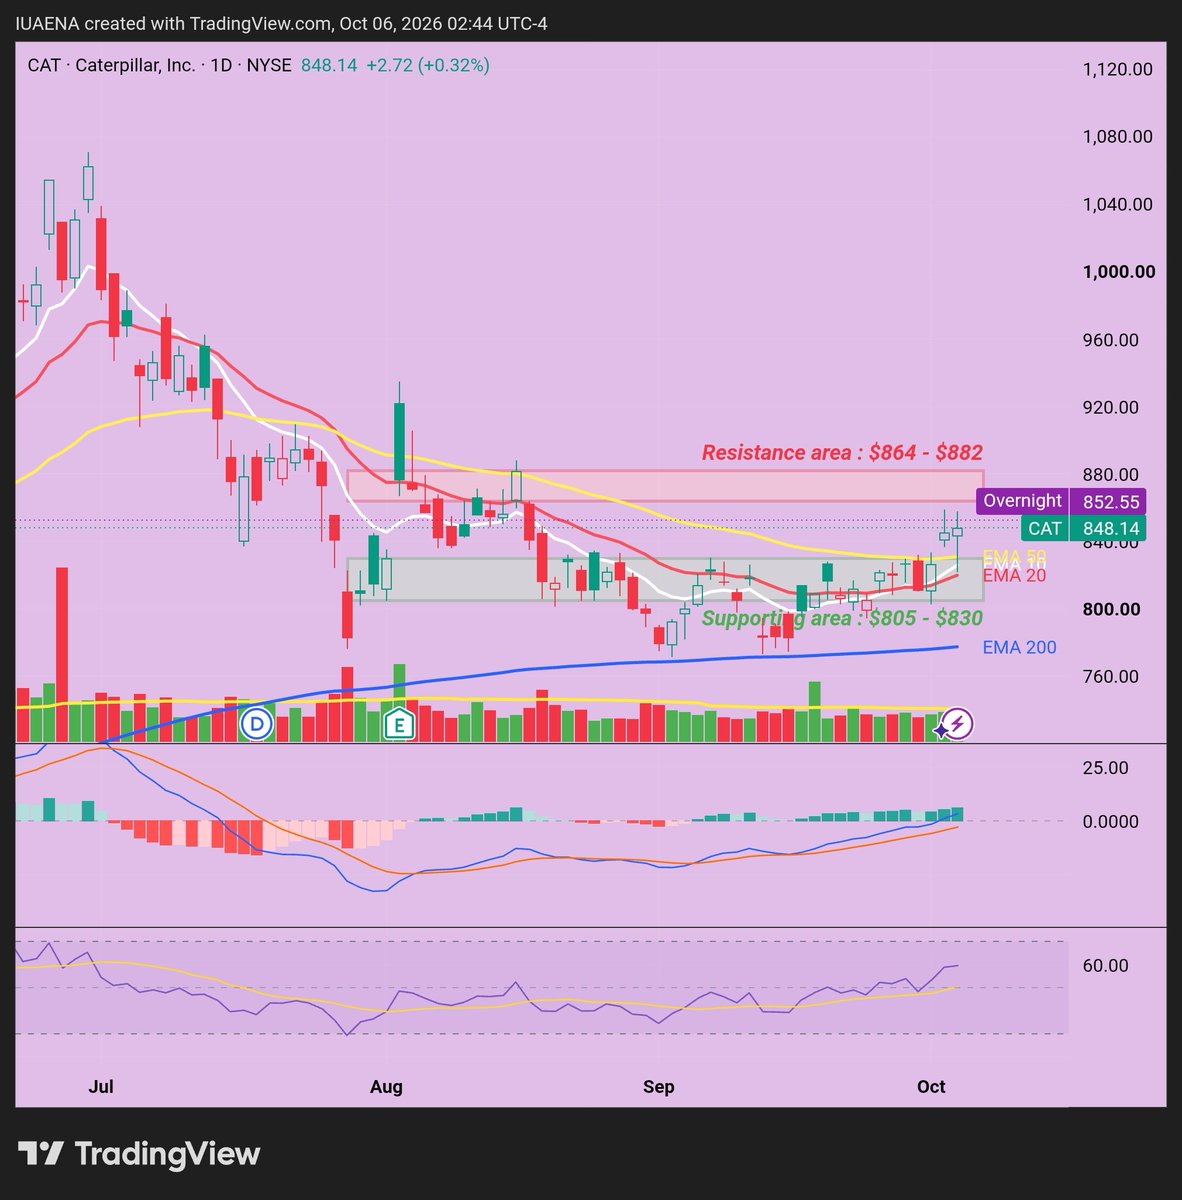
$CAT
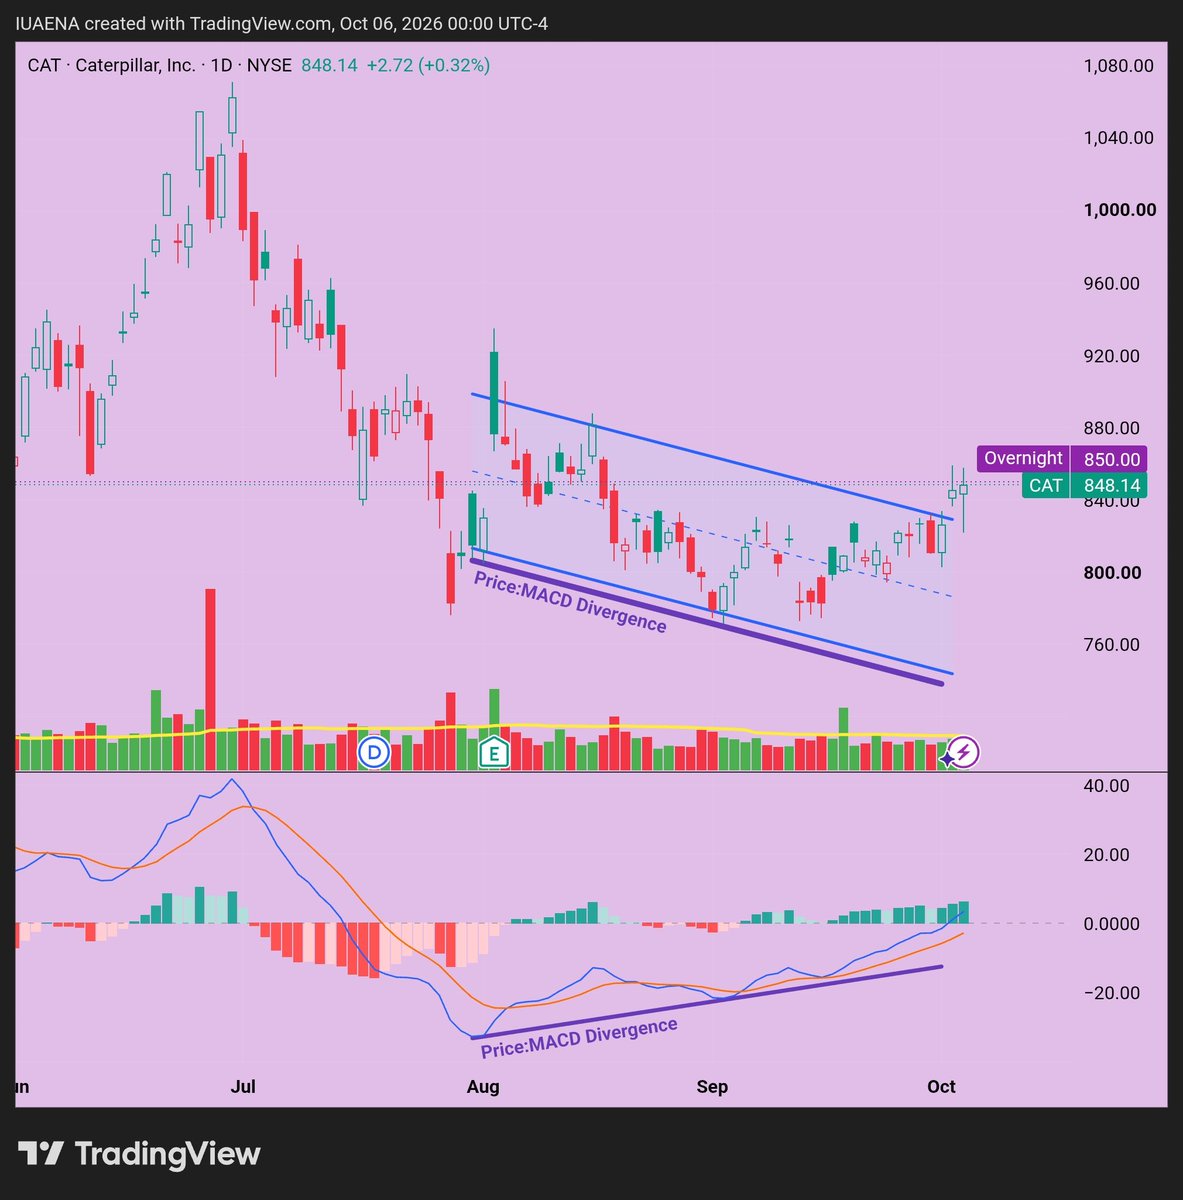
CAT 可能即將出現低位突破🚜📈。
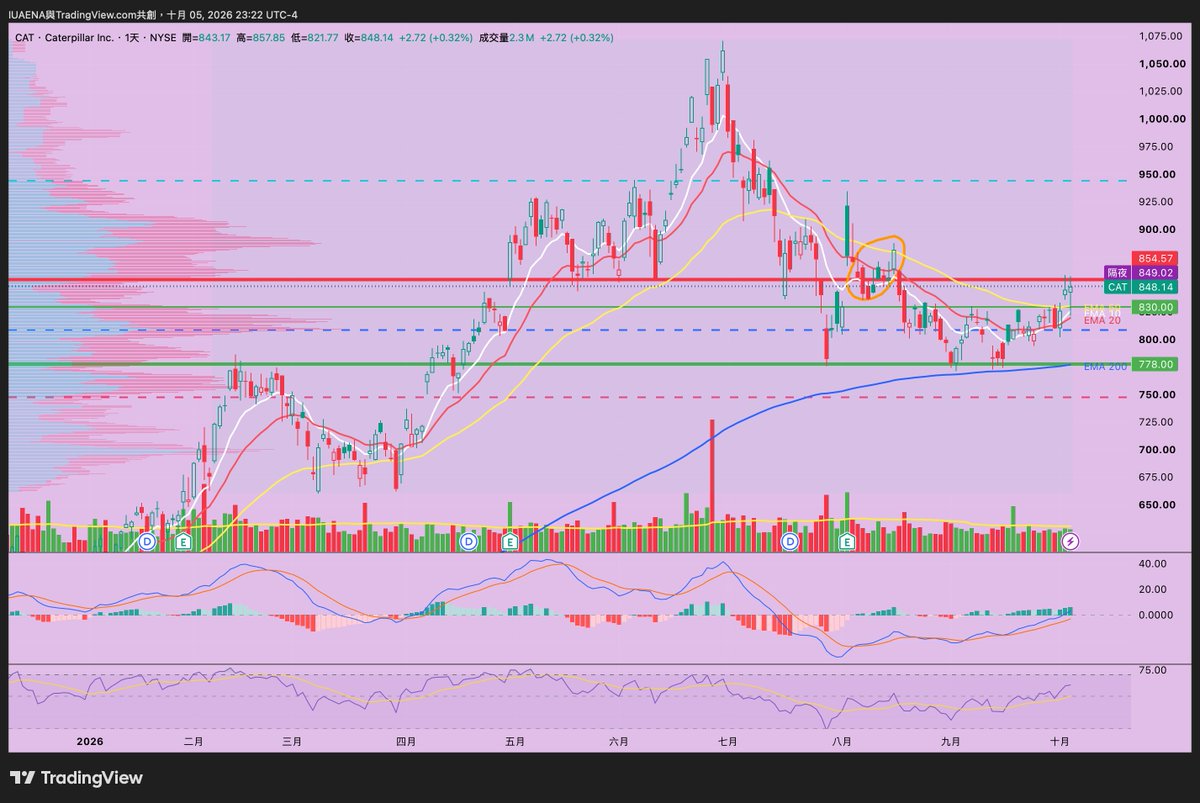
股價在2026年2��中的前高位約$778形成了一個強勁的支撐位,並且成功於2026-07-29, 2026-09-01及2026-09-14至2026-09-16,五個交易日得到驗證。尤其是在2026-09-14至2026-09-15期間同時在200 EMA附近得到支撐。
股價由2026-07-01至2026-08-03期間��行Lower Highs & Lower Lows大幅度回調。2026-08-04 業績發布後死貓彈了一下又繼續下跌。
但自從2026-08-04後至2026-10-01期間,價格與MACD明顯地形成底背離 (Bullish Divergence) 。股價在整個8月份雖然繼續是以一浪低於一浪地下跌,但MACD動能就一直上升而呈現一浪高於一浪。
我在此底背離期間以2026-07-31和2026-09-01的兩個低點和業績後於2026-08-17反彈時的高點,串連成一個下行通道。
股價於2026-09-14至2026-09-16 觸及$778這個長期支撐及200 EMA線上方後反彈,同時MACD 上升加速。
價格形態開始出現higher low。
直至2026-10-02 MACD線終於穿越零軸,股價亦突破先前的下行通道。
昨日2026-10-05維持升勢,以長下影線但燭身偏小的小陽燭繼續維持在下行通道之上。
接下來我會注意以下兩點👀:
1. 股價已經突破9月初的前高位$830 (Higher High) 而形成新的支撐區域為$805-$830。我期望股價往後pull back時能在此支撐區域上反彈而形成Higher Low。
2. EMA 10暫時升穿 EMA 20, 但斜度不足且過於平坦。我需要等待EMA 10 保持在 EMA 20之上而它們一起向上彎升,甚至EMA 10 & 20都一起升穿 EMA 50 才能進一步確認估價築底轉勢。
基於我對CAT是長線投資 (U mode), 我會等待股價pull back至$830 支撐區 (同時是 EMA 50) 時加倉。假如股價直衝阻力區,就等待確認突破後便加倉。
CAT might be gearing up for a bottom breakout 🚜📈
The previous mid-Feb 2026 high around $778 has turned into solid support, confirmed across 5 separate trading sessions: 2026-07-29, 2026-09-01, and 2026-09-14 through 2026-09-16. Notably, between 2026-09-14 and 2026-09-15, it found confluent support right around the 200 EMA.
From 2026-07-01 to 2026-08-03, the stock saw a deep pullback printing lower highs and lower lows. Following earnings on 2026-08-04, we got a dead-cat bounce before the selloff resumed.
However, from 2026-08-04 through 2026-10-01, price and MACD carved out a textbook bullish divergence. Even though price continued to bleed lower through August, MACD momentum steadily climbed, printing higher lows.
Connecting the two swing lows on 2026-07-31 and 2026-09-01 with the post-earnings bounce high on 2026-08-17 outlines a clear descending channel.
Price tagged the long-term $778 support and bounced above the 200 EMA between 2026-09-14 and 2026-09-16, with MACD momentum accelerating to the upside.
Price action started printing a higher low.
Then on 2026-10-02, MACD finally crossed above the zero line, and price broke out of the descending channel.
Yesterday (2026-10-05) kept the momentum going, closing as a small green candle with a long lower shadow while holding firmly above the breakout channel.
Here are the 2 key things on my radar 👀:
* Price already cleared the early-September swing high at $830 (Higher High), establishing a new support zone between $805 and $830. On any upcoming pullback, I want to see price bounce out of this zone to form a confirmed Higher Low.
* The 10 EMA just crossed above the 20 EMA, but the slope is still flat and lacks steepness. I need to see the 10 EMA hold above the 20 EMA with both curling upward together—or better yet, both crossing above the 50 EMA—to further confirm a true bottom reversal.
Since CAT is a long-term hold for me (U mode), I am looking to add on a pullback to the $830 support zone (which aligns with the 50 EMA). If it rips straight into overhead resistance instead, I will wait for a clean, confirmed breakout before adding.