Hey friends, this will be our last post here but we’re keeping our profile as an archive. Find us on other platforms to stay updated.
https://t.co/oG6fxr4Bl6
On Wednesday, January 29, we will explore data sketching through an interactive hands-on workshop led by 3 visualization experts from Interactive Things. Join us for a creative session visualizing data using analog materials and collaborative techniques.
https://t.co/UvqMsBFp50
Welcome, Noah! He is passionate about developing data-driven software that enhance efficiency, usability, and productivity. Freshly graduated from his automation engineering apprenticeship at Siemens, Noah joins our team with a strong interest in innovation and entrepreneurship.
Job: We’re looking for a project manager (all genders) to join our team in early 2025. If you care about helping technical teams stay creative and productive and understand how clear and calm management enables great work, we want to hear from you!
https://t.co/NIDt6cIsER
As is tradition in our studio, we took a few days off from our work on client collaborations to satisfy our curiosity and recharge our creativity during our annual Team Hackdays. Here are some of the ideas our team has worked on.
Thank you to our team members Annina, Beatriz, Christian, Mark, Michela, Patrick, and Solange for bringing this product to life to our colleagues at Shiftcode for your expert engineering support.
New Work: The UIS Data Browser is the definitive source for educational, scientific, and cultural statistics managed by the @UNESCOstat. The platform enables people to discover, visualize, and analyze a wealth of data.
https://t.co/ljnnb0AIse
The new Data Browser is the result of our continued partnership with UNESCO, helping them make their data resources more accessible and approachable for everyone, and we’re immensely grateful for the opportunity to serve them.
A big thank you to our collaborators at OECD for your trust and our team members Chris, Florencia, Lloyd, Michael, Tania, and Tomáš for bringing this product to life.
We are deeply committed to collaborations of this kind. Visualizing evidence-based insights that will positively impact the wellbeing of individuals and communities through the systemic power of better policies.
A series of interactive visualizations showcase the progress of individual economies and the region over time, enhancing the understandability, accessibility, and dissemination of the assessment results.
The Competitiveness Data Hub, created for the @OECDglobal and the @EU_Commission, helps the six Western Balkan economies benchmark their economic reforms essential to competitiveness and formulate better policies in response.
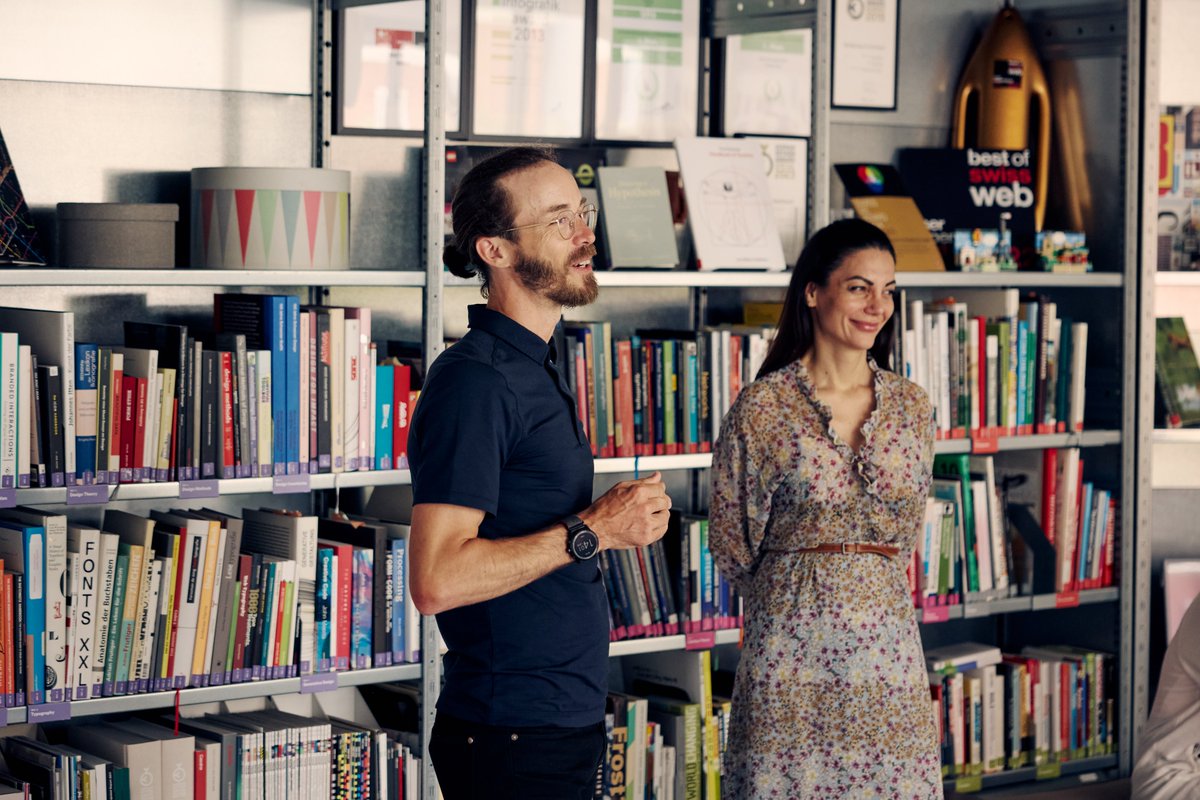
Our team assembly also provides space for connecting with one another. We enjoyed a presentation by Roy Brüllhardt of Mutzone, took a tour to learn about the history of our neighborhood in Kreis 4, and visited the exhibition of Interaction Design graduates at the @zhdk.
Last week, our team took a break from client collaborations to rethink and revise how our organization operates. This year, we focused on creating a more empowering workplace for everyone.
We also held open sessions on topics proposed by our team. We explored the concept of personal user guides to establish greater empathy and facilitate better collaboration. Additionally, we shared insights from our interdisciplinary collaboration driven by design tokens.