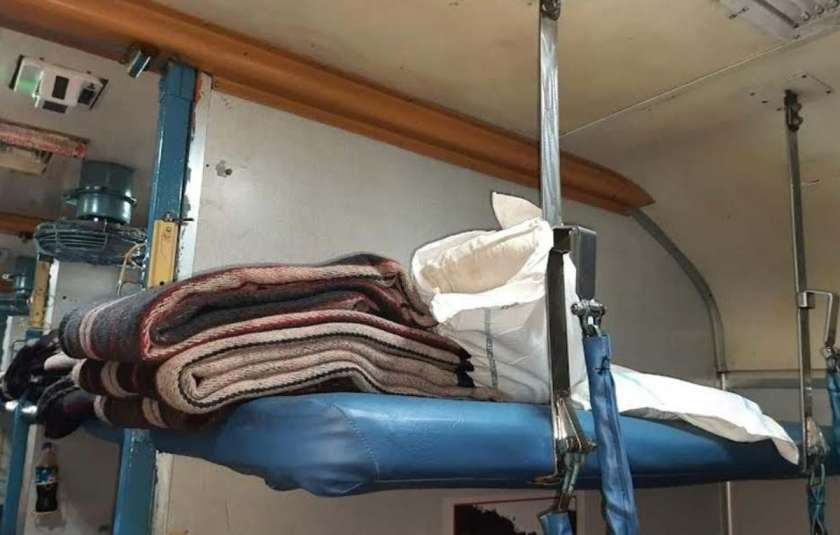
🚆 1.27 crore+ bedroll items missing from Indian Railways AC coaches
🔹 Over 1.27 crore bedsheets, towels, blankets & pillows went missing between Jan 2022 and May 2026, an Indian Express RTI data reveals.
🔹 Linen thefts have risen 56% since 2022 — roughly 1 in every 1,000 AC passengers walks away with at least one item.
🔹 Estimated loss: ₹104.51 crore, much of it reportedly recovered from coach attendants earning as little as ₹700 a day.
🔹 Face towels are the most stolen item (46.54 lakh missing).
🔹 Bikaner Division recorded the highest losses (25.76 lakh items), with thefts rising 4x since 2022.
🔹 Delhi Division cut thefts by 79%, while Tiruchirappalli and Palakkad reported zero thefts.
(Indian Express)
⌚ India emerges as a fast-growing market for Swiss watches.
India ranked 14th among the top markets for Swiss watch exports during January–September 2026.
Top markets (export value in million Swiss francs):
🥇 1. 🇺🇸 USA: 3,371 (-4.1%)
2. 🇫🇷 France: 1,677 (+79.9%)
3. 🇯🇵 Japan: 1,392 (+1.6%)
4. 🇬🇧 UK: 1,361 (+8.3%)
5. 🇭🇰 Hong Kong: 1,338 (+2.7%)
6. 🇨🇳 China: 1,247 (-5.9%)
🇮🇳 14. India: 266 (+28.5%)
India recorded 28.5% growth, significantly ahead of global growth of 2.7%.
🌍 Global Swiss watch exports: CHF 19.46 billion (+2.7%).
(FSWI)
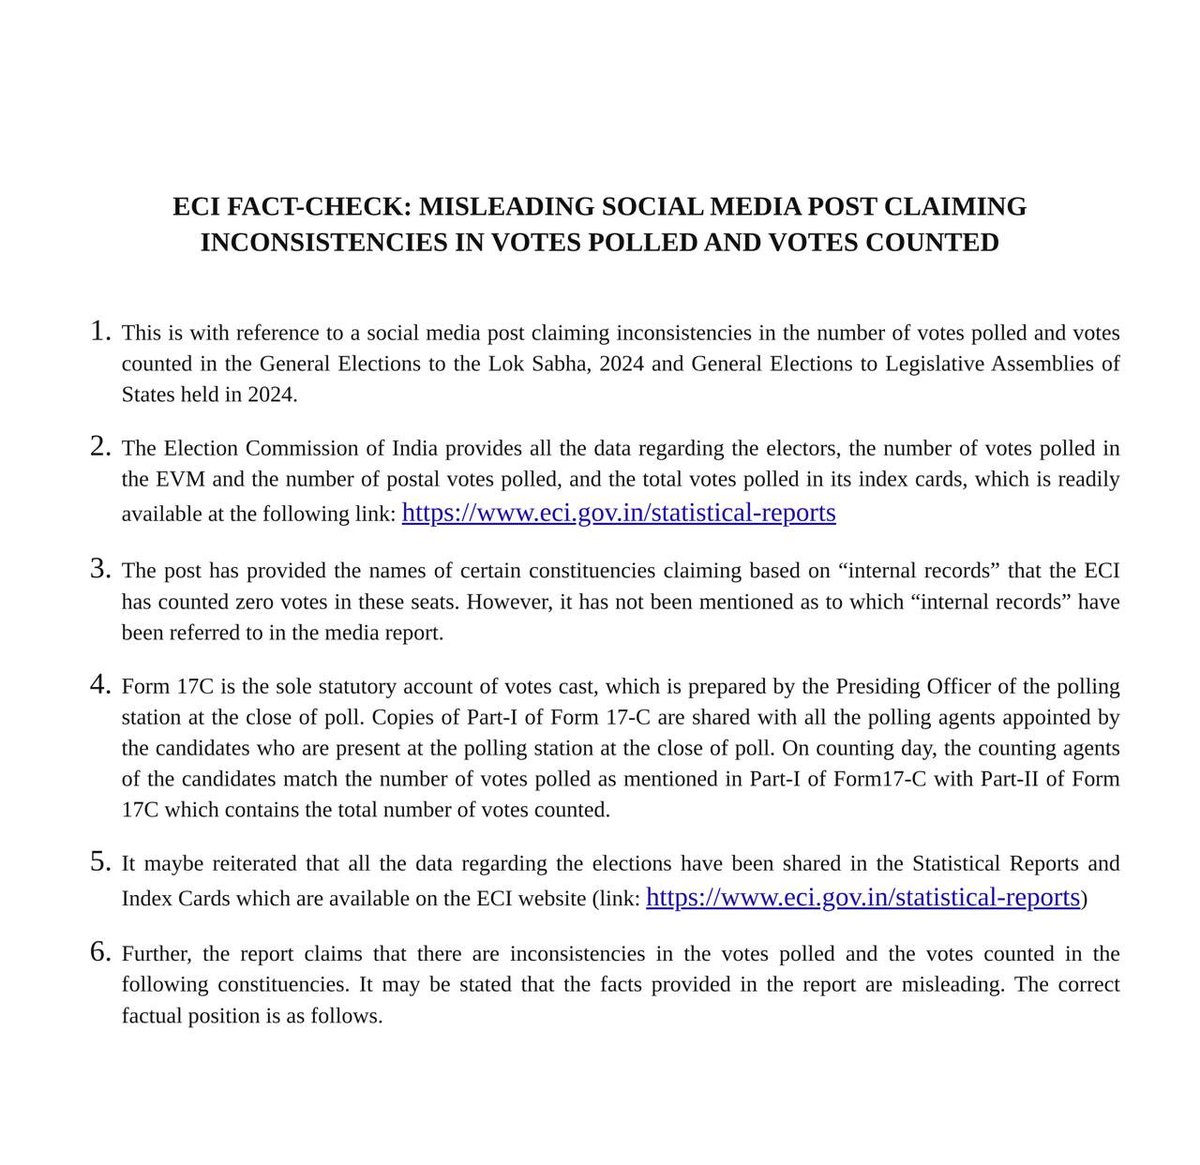
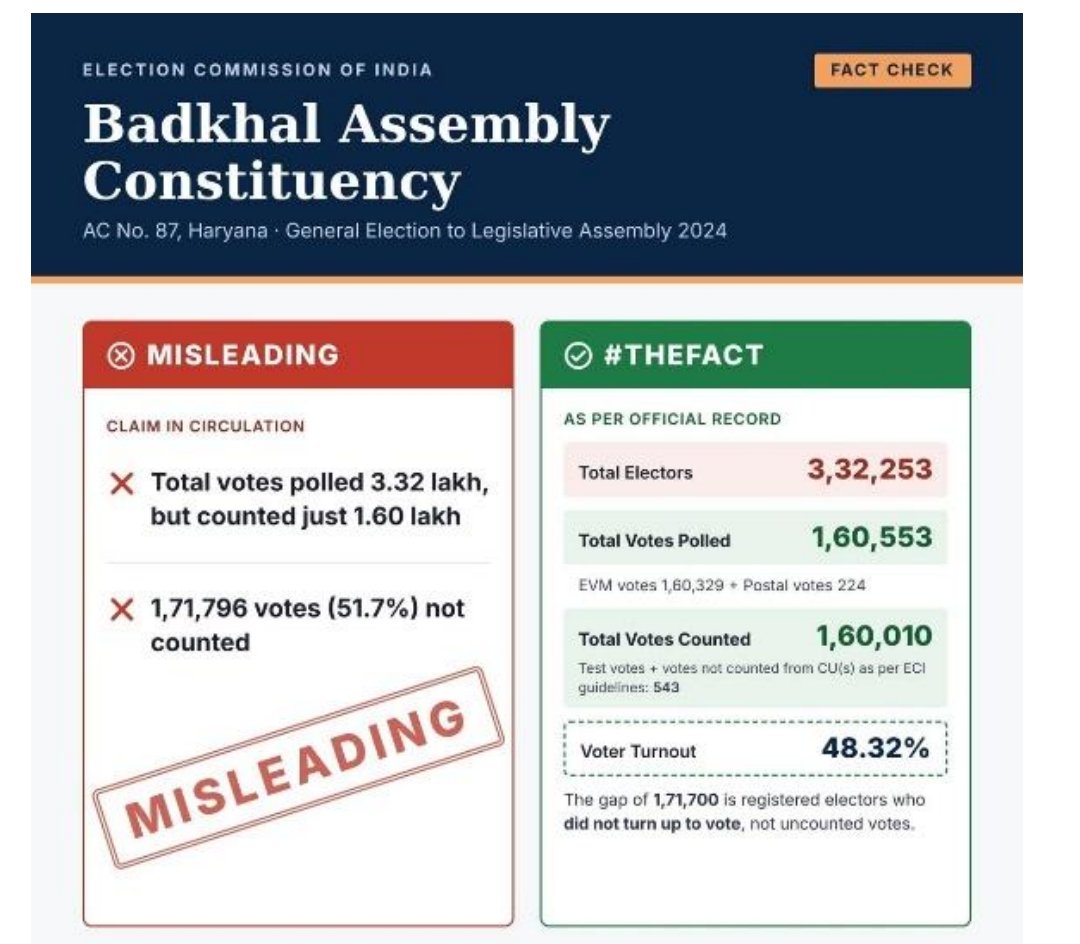
#ECIFactCheck : MISLEADING SOCIAL MEDIA POST CLAIMING
INCONSISTENCIES IN VOTES POLLED AND VOTES COUNTED IN THE GENERAL ELECTIONS TO THE LOK SABHA, 2024 AND GENERAL ELECTIONS TO LEGISLATIVE ASSEMBLIES OF STATES HELD IN 2024.
(1/3)
Amid two wars, geopolitical uncertainty and a global energy shock, India’s economy continues to demonstrate remarkable resilience.
Moody’s has raised India’s FY27 growth forecast to 7%, up from 6.5%, signalling confidence in the country’s economic fundamentals.
This resilience reflects the policy direction under PM Narendra Modi — sustained infrastructure investment, a manufacturing push, stronger domestic capacity and diversification of energy supplies.
At a time when many economies are grappling with uncertainty, India’s ability to sustain growth close to 7% is a significant achievement.
The real story is not just the growth forecast, but the resilience behind it.
https://t.co/nr469yeEPW
🇮🇳 India's per capita GDP has risen nearly 882 times since 1951 and has almost tripled since 2014.
Per Capita GDP Growth (₹)📈
• 1951: ₹285
• 1964: ₹497
• 1974: ₹1,159
• 1984: ₹3,113
• 1994: ₹9,821
• 2004: ₹26,050
• 2014: ₹89,796
• 2019: ₹1,42,424
• 2026: ₹2,51,393
Per Capita GDP = Total GDP ÷ Population
(RBI)
🚇 Good news for Noida Extension residents!
The Cabinet has approved the extension of the Aqua Line Metro corridor from Noida Sector 51 to Greater Noida Sector 4.
Key highlights:
Route length: 8.449 km
Stations: 5
Better metro connectivity for Greater Noida West
Improved connectivity with Noida and the wider NCR network
A major step towards easing daily commutes for residents of Noida Extension.
Tata Advanced Systems builds the C295 military transport at Vadodara, and the first made-in-India aircraft has completed its maiden flight. Defence supply chains need undivided national accountability, right up the ownership chain. The Tata Sons leadership battle is for the whole country to follow keenly. https://t.co/hlwI9ymyzk
🌍 How many people living in India were born abroad?🇮🇳
INDIA: Immigrants as a share of total population
1990: 0.8%
2000: 0.6%
2005: 0.5%
2010: 0.5%
2015: 0.4%
2020: 0.4%
2024: 0.3%
WORLD
1990: 2.9%
2024: 3.7%
India remains one of the world's least immigrant-dependent societies.
(United Nations Department of Economic and Social Affairs (2024))
🌍 India Has the World's Largest Diaspora🇮🇳
Top 10 countries by number of people living abroad (2024)
1. 🇮🇳 India – 18.5 million
2. 🇨🇳 China – 11.7 million
3. 🇲🇽 Mexico – 11.6 million
4. 🇺🇦 Ukraine – 9.8 million
5. 🇷🇺 Russia – 9.1 million
6. 🇸🇾 Syria – 8.9 million
7. 🇧🇩 Bangladesh – 8.7 million
8. 🇻🇪 Venezuela – 8.3 million
9. 🇦🇫 Afghanistan – 7.5 million
10. 🇵🇭 Philippines – 7.0 million
(UN DESA, International Migrant Stock 2024)
🏙️ How Land Costs Rise With Urbanisation In India🇮🇳
🏡 Share of Land vs Construction Cost Across Areas
Rural: Land 10% | Construction 90%
Semi-urban: Land 35% | Construction 65%
Urban: Land 46% | Construction 54%
Metro: Land 63% | Construction 37%
(Niti Aayog)