Hello world!
Meet BIPED, a new European initiative that fast-tracks cities to climate-neutrality through an ambitious district transformation 🏙⚡️
Starting our kick-off meeting in the Brabrand district of Aarhus, our test bed, to be followed by a tour of the area
#PED
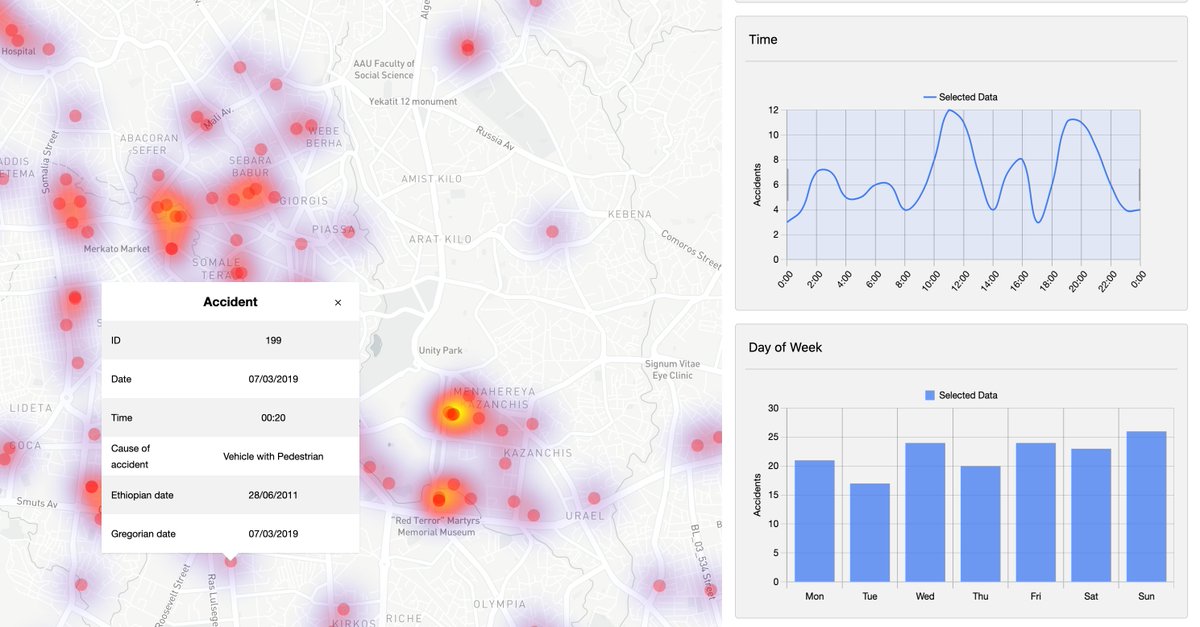
Our project supports traffic safety in Addis Ababa by helping policy makers and city operators make decisions based on data-driven insights. Read about results https://t.co/Wl3HsO6yav supported by
@CzechMFA@UNDP@UNDPEthiopia#development#traffic#safety
It’s our pleasure to release the new comparison functionality of GLayer that allows users to select own time periods to compare, save them as filter sets, and compare them in map and charts. More at https://t.co/ItxS41biSk #GLayer#visualanalytics
In November 2022, InnoConnect started working on a new traffic safety project in Ethiopia, named Safer Roads in Ethiopia through Identification of High-risk Locations. Read more at https://t.co/E3ISSpWguw
supported by @CzechMFA@UNDP#development#traffic#safety
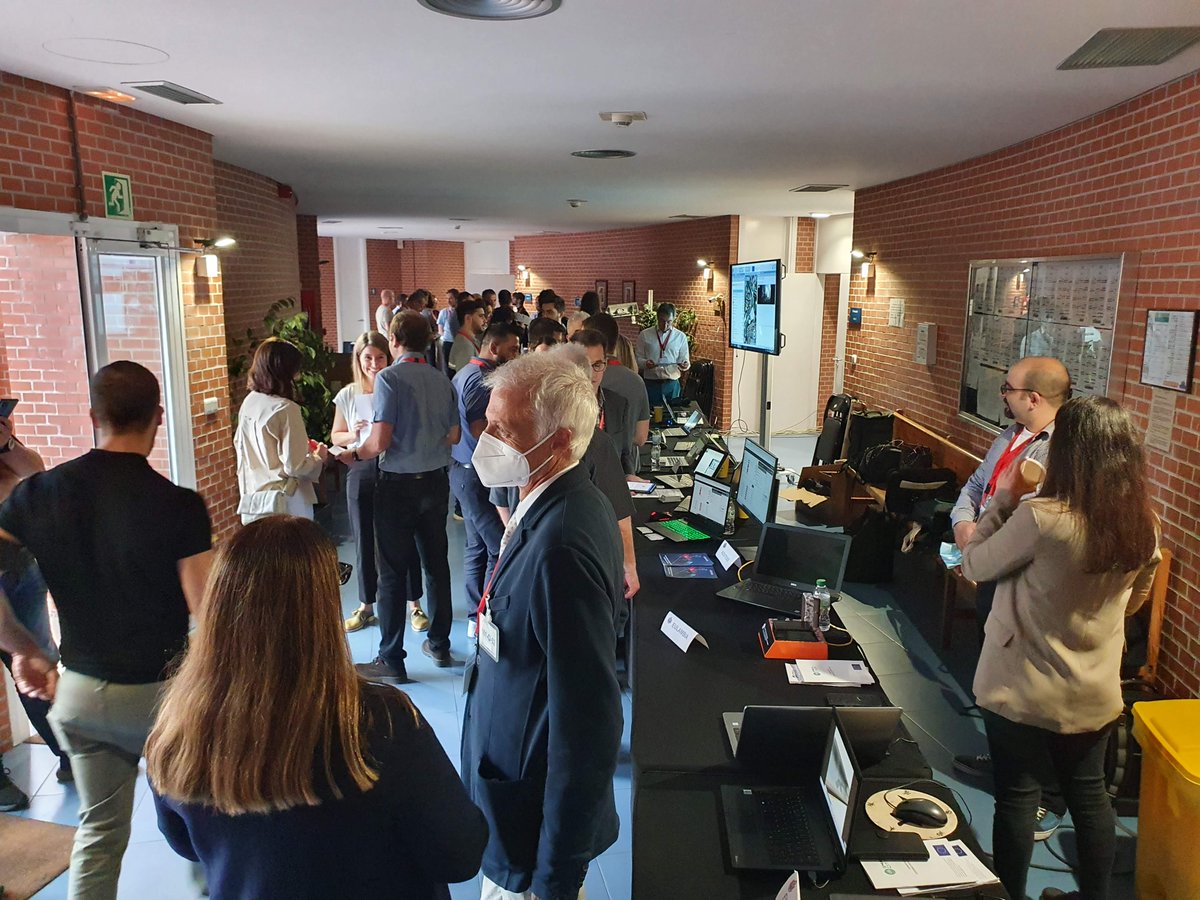
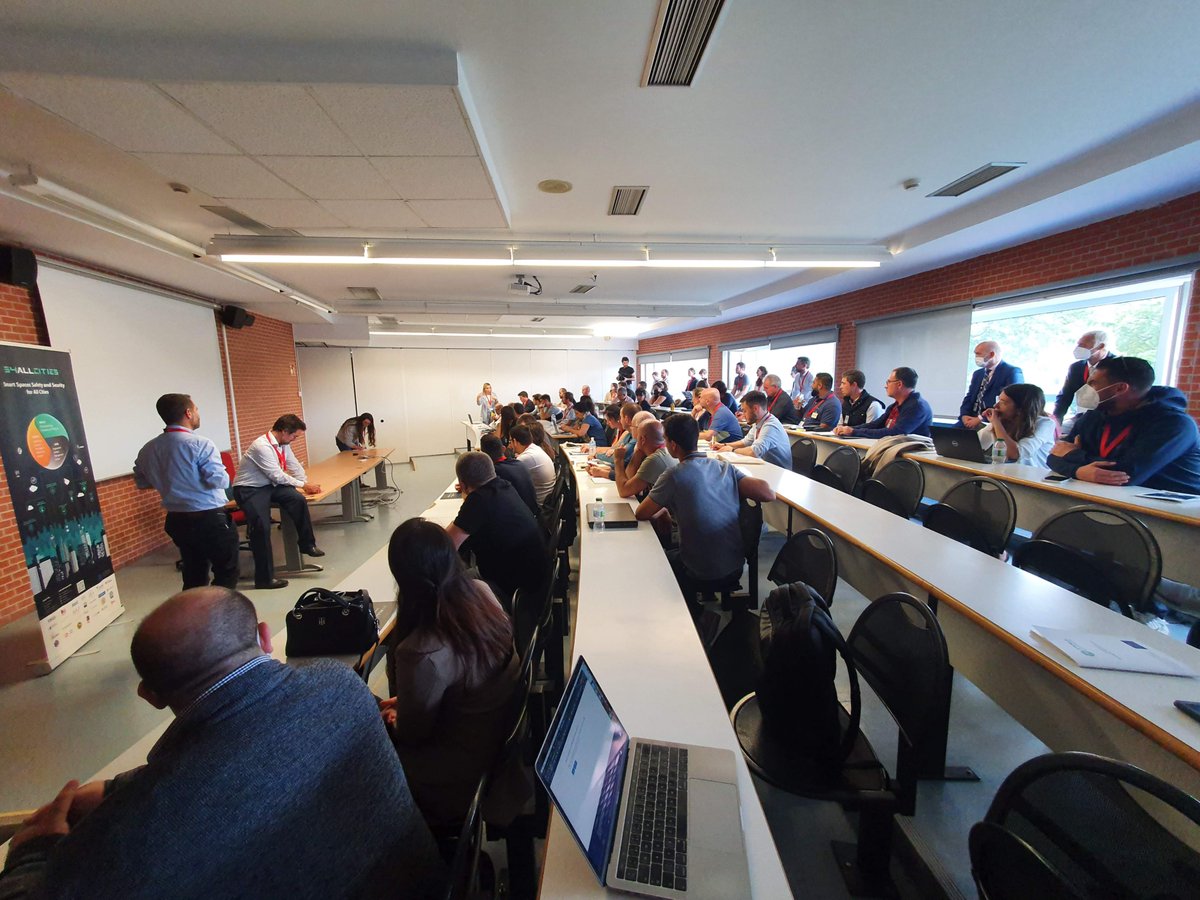
In Bilbao, @JiriBouchal just presented the results of #TraMod and #GLayer integration into the system for secure and safety cities developed in @s4allcities and tested in PIlsen. Watch the impressive Pilsen pilot video at https://t.co/KeiFrd2b6S
We’re pleased to announce that @DuetH2020, the #DigitalTwins innovation project that InnoConnect participates in, was today presented to the Ministers of EU member states, video at https://t.co/Llq7sGCMJl, read more at https://t.co/BpdJkFLTNF
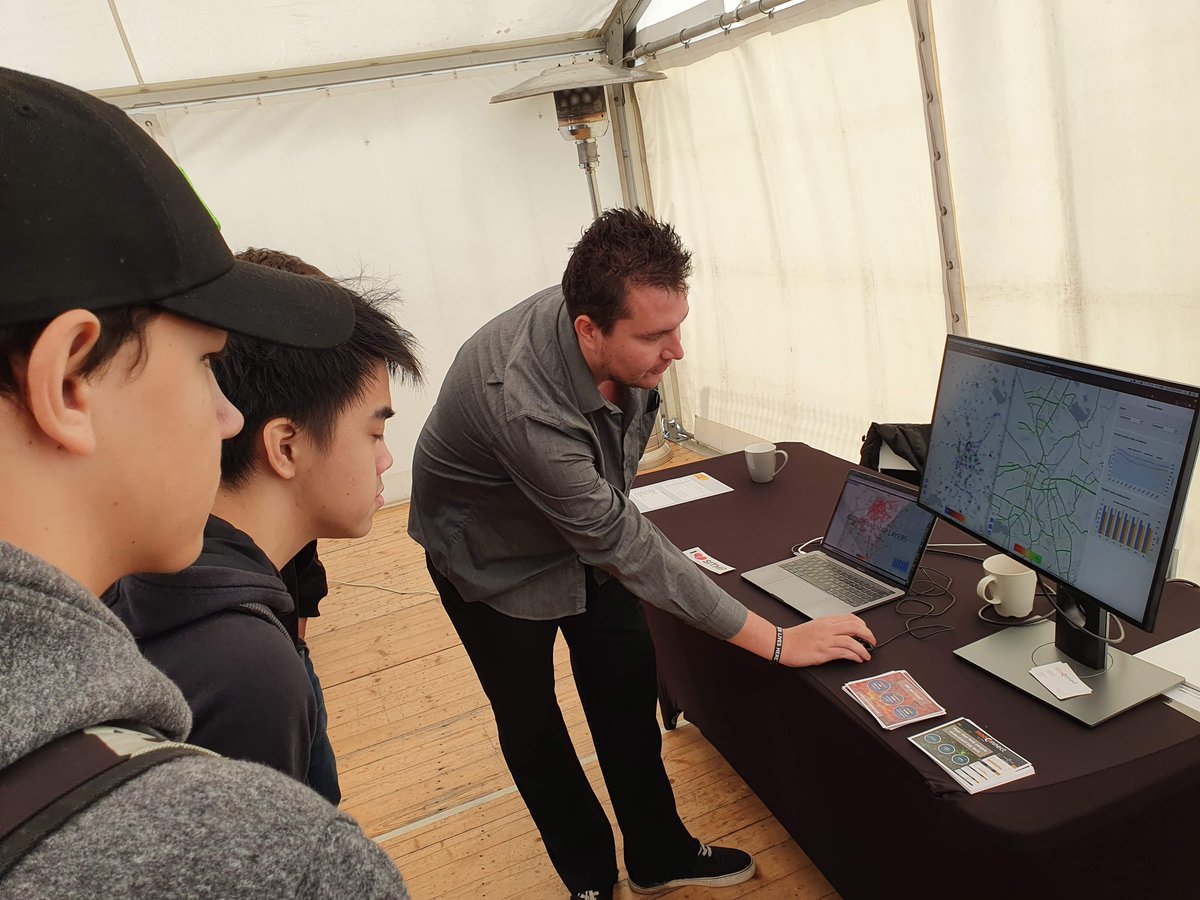
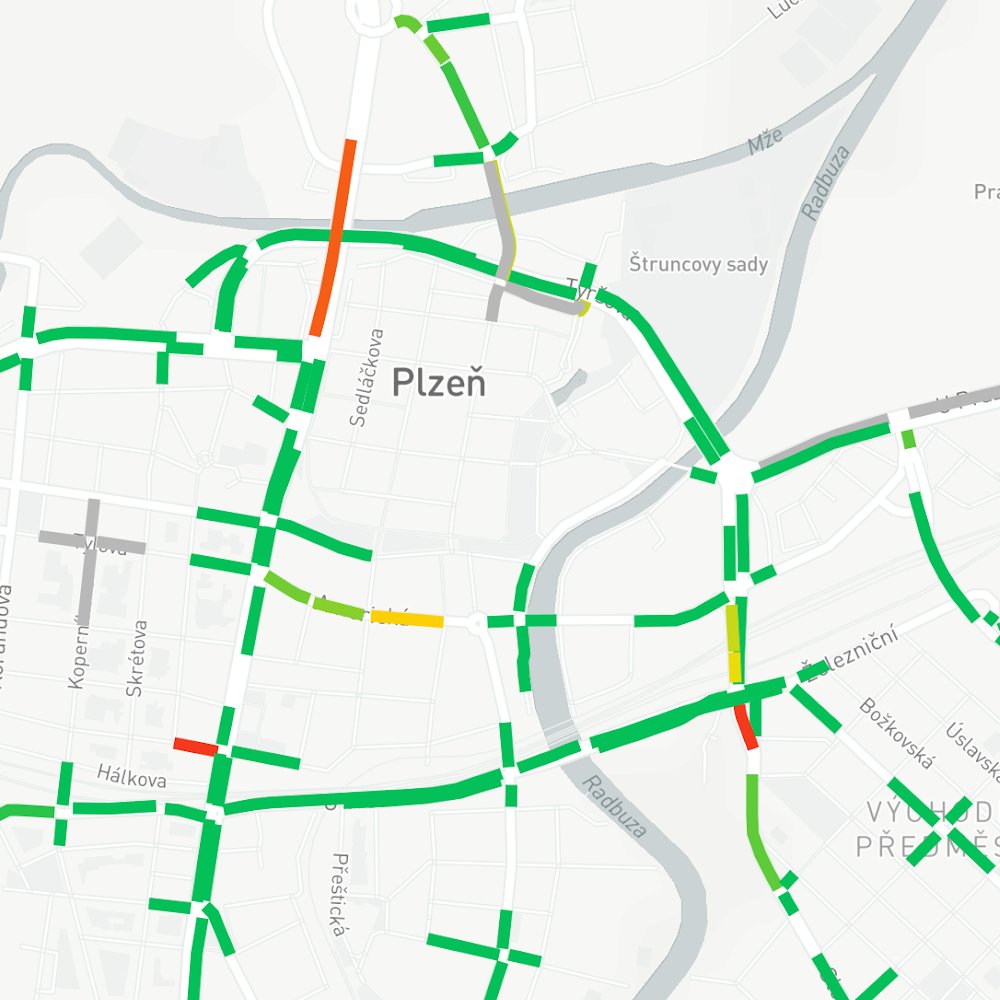
We have recently released the prototype of the Analytical Map of Traffic in Pilsen. It includes live and historical #floatingcardata and traffic sensor data. Check it out. More details at https://t.co/lneVVO5GhO #GLayer#visualanalytics@BowiProject@DuetH2020
Last week, together with #RoadTwin, we presented our Pilsen mobility maps to many students and other visitors of #InovujemePlzen innovation festival. It's always encouraging to get positive feedback on our work! Check the maps at https://t.co/ydzTNAYWoh @DuetH2020@smartcityplzen
We've started working on #FlowMap, an analytical map of traffic flows in the Pilsen region. Built with #GLayer. Read more at https://t.co/MDX8TzAwsg and here https://t.co/XdHxE6aZAK @BowiProject@smartcityplzen
InnnoConnect is proud to announce that we will start developing FlowMap, an analytical map of the traffic flows in the Pilsen region. We're excited to experiment with the big #floatingcardata#FCD in @smartcityplzen. More at https://t.co/MDX8TzAwsg
Handling traffic is one of the biggest nightmares for cities. Every little decision can backfire into a major snowball effect, so authorities need accurate data and prediction tools to make sure they make the right decision. #visualanalytics#accidentmap https://t.co/TDUa1j3puZ
Spustili jsme novou verzi analytické #COVID-19 mapy nad daty KHS od @ZdravkoOnline. Analyzujte interaktivně data po okresech, dnech, pohlaví, věku na https://t.co/G8n4MHOFc6 fyi @ChytraKarantena
Our interactive Map of #COVID-19 spread in Czechia has just been officially published on the EU’s Open Data Portal as an application that demonstrates the potential of EU's open data https://t.co/IewhKnWZz6 #visualanalytics#webglayer @PoliVisu @EU_opendata
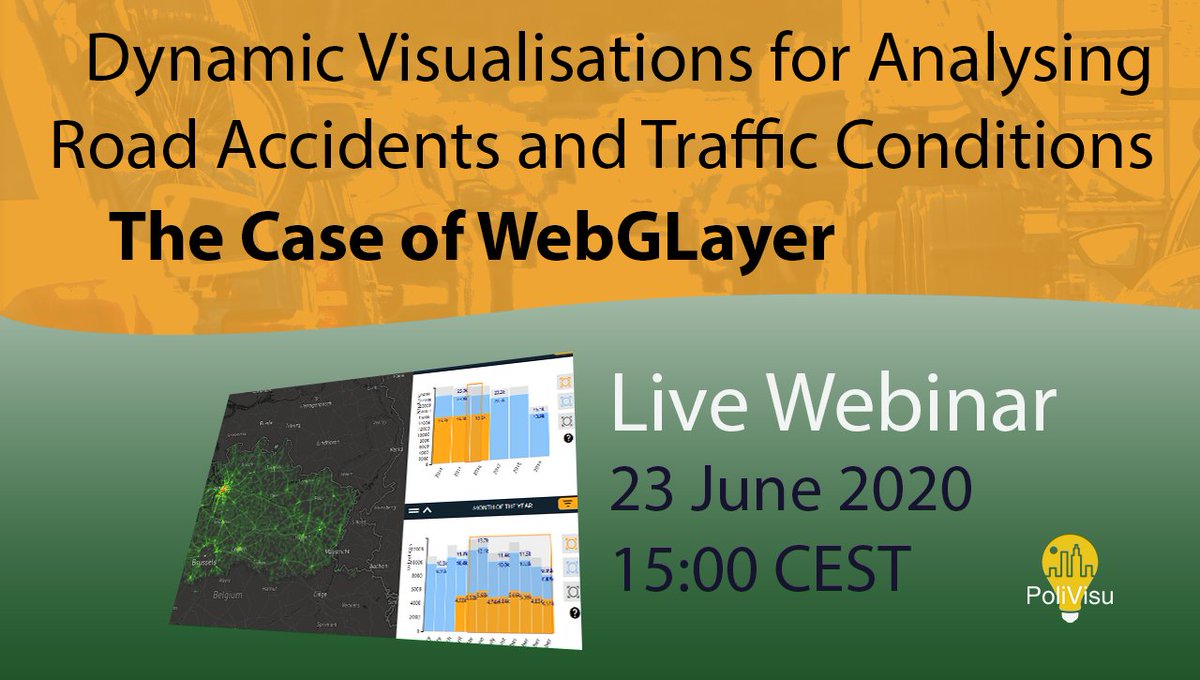
Excited to announce our #webinar on dynamic #visualizations. Join us 23.06 @ 15:00 CEST to find out how #Flanders and #Pilsen used the #WebGLayer tool to derive insights from complex datasets and inform policy making. For more info & to register 👉 https://t.co/UXPTx1GJmc #H2020
Excited to announce our #webinar on dynamic #visualizations. Join us 23.06 @ 15:00 CEST to find out how #Flanders and #Pilsen used the #WebGLayer tool to derive insights from complex datasets and inform policy making. For more info & to register 👉 https://t.co/UXPTx1GJmc #H2020
Město Plzeň pomocí aplikace z naší dílny (https://t.co/hepUO0QSaH) zpracovalo analýzu dopadu #COVID__19 na dopravu v Plzni. Dopravní intenzita poklesla v průměru až na 64% původní hodnoty. Více na https://t.co/3IFYQAEK3d #WebGLayer#VisualAnalytics@smartcityplzen