Two live FX strategies. Two different architectures.
🔶 Coral Smart Hedge DCA
• 5+ years live
• 8,000+ trades
• ~77% profitable trades
🔷 CoralGrid DCA Sentinel
• New-generation system
• Directional signal entries
• Progressive DCA
• Sentinel Hedge protection
Both run on live accounts with independently tracked performance.
Compare the strategies & review the live track records:
https://t.co/ScP99ufowH
Past performance does not guarantee future results. Forex trading involves substantial risk.
@ZacTradesFX Appreciate that. You’ve captured the tension well. A directional lean still needs price confirmation; when the drivers pull in different directions, confidence should reflect that. I’d rather be transparent about the uncertainty than force a stronger call.
GBPUSD W42: A bearish three-week view, with low confidence.
At 13/10/2026 05:01 UTC, GBPUSD was 1.32168, below weekly VWAP 1.32403 and below weekly TrendSL 1.34076. Source: mt5:GBPUSD.sml:1m, a timestamped broker quote.
If price sustains above 1.32403, the momentum warning against the bearish thesis would activate and call for reducing risk. This condition remains pending; it does not require a weekly close.
A completed weekly close above 1.34076 would invalidate the bearish structure, requiring an exit from the bearish thesis and reassessment. This condition remains pending.
Mace News headlines on 13 October report Greene calling for proactive action against second-round inflation risks while describing a loose UK labour market. This is one MPC member's view, not a rate decision. Firmer UK rate expectations could support sterling relative to the dollar; the remarks are not automatically bearish for GBP.
Reuters on 12 October described sterling holding steady as the dollar remained firm. Watch DXY and comparable UK-US yields to assess whether that pressure persists. A US yield level alone cannot establish the spread, and a softer CPI result does not guarantee lower real yields.
ForexFactory, a secondary calendar source retrieved on 13 October, lists US CPI on 14 October, UK GDP and US retail sales/PPI on 15 October, and BoE Governor/Fed Chair appearances on 16 October. Outcomes are unknown.
For new exposure, wait for the releases and the subsequent currency and bond response before assessing entry timing. Existing shorts should distinguish the momentum warning from structural invalidation and apply their own risk limits. A downward trend does not make every entry attractive.
FXSSI's broker sample dated 13 October shows 71% on the buy side and 29% on the sell side. The precise provider observation time is not established here. This is not the whole currency market and does not locate stops, quantify leverage or prove that forced selling will follow. Its contrarian context cannot replace confirmation from price and relative yields. The earlier Reuters report linking sterling strength to lower oil is prior-week context only.
#GBPUSD #BoE #DXY #CPI
GBPUSD has a bearish trend, but could firmer BoE expectations challenge the next move? The three-week view has low confidence.
At 13/10/2026 05:01 UTC, GBPUSD was 1.32168, below weekly VWAP 1.32403 and below weekly TrendSL 1.34076. Source: mt5:GBPUSD.sml:1m, a timestamped broker quote.
If price sustains above 1.32403, the momentum warning against the bearish thesis would activate and call for reducing risk. This condition remains pending; it does not require a weekly close.
A completed weekly close above 1.34076 would invalidate the bearish structure, requiring an exit from the bearish thesis and reassessment. This condition remains pending.
The full analysis examines Greene's inflation argument, the UK-US yield comparison and the limits of retail positioning. Follow DXY and bond responses around the data rather than assuming a headline guarantees a currency move.
Read the analysis: https://t.co/OrH5CbG8lt
---
Intermarket Edge | Institutional Macro & Intermarket Analysis
For informational and educational purposes only. Not financial advice.
Gold is rebounding, but the broader trend assessment still points down. Why does the analysis choose to stand aside?
At 12/10/2026 07:41 UTC, XAUUSD was 4198.50 USD per troy ounce, above weekly VWAP 4195.23. Price remains below weekly TrendSL 4394.02. Source: mt5:XAUUSD.sml:1m, a timestamped broker quote. The near-term momentum warning against the bearish view is already active. This is not a future contingency and does not require a weekly close.
The full article examines:
-> Why lower oil does not automatically lower real yields.
-> How to separate a rebound from a structural reversal.
-> What the FXSSI broker sample can and cannot establish.
A completed weekly close above 4394.02 would invalidate the bearish structure. That condition remains pending; an intraday move is not a completed weekly close.
Read the full analysis: https://t.co/Ioo9wNvfwP
---
Intermarket Edge | Institutional Macro & Intermarket Analysis
For informational and educational purposes only. Not financial advice.
Gold W42: Bearish direction, stand-aside decision.
Daily, weekly and monthly trend assessments point down, but near-term momentum is working against the bearish view. A rebound is not yet a structural reversal, and the trend alone does not justify a new short.
At 12/10/2026 07:41 UTC, XAUUSD was 4198.50 USD per troy ounce, above weekly VWAP 4195.23. Price remains below weekly TrendSL 4394.02. Source: mt5:XAUUSD.sml:1m, a timestamped broker quote. The near-term momentum warning against the bearish view is already active. This is not a future contingency and does not require a weekly close.
A completed weekly close above 4394.02 would invalidate the bearish structure. That condition remains pending; an intraday move is not a completed weekly close.
Reuters on 12 October linked gold's rise to a softer dollar and oil. Actual extra energy supply remains uncertain. Lower oil does not automatically lower real yields: nominal yields and inflation expectations can change differently.
ForexFactory, a secondary calendar source retrieved on 12 October, lists CPI on 14 October, retail sales and PPI on 15 October, and a Fed Chair appearance on 16 October.
For new exposure, wait for clearer agreement between price and the wider evidence. Existing short exposure warrants reviewing and reducing risk under the trader's plan while the warning is active. Check fresh DXY and real yields alongside gold after the releases; do not assume one inflation outcome guarantees a particular currency or bond response.
The entry trap is confusing an intact downward trend with attractive timing. A single price observation does not establish sustained acceptance, and the weekly average can change as the week develops. Its role differs from the completed weekly closing condition at the structural reference. Neither distance to that reference nor the direction of the last headline provides a position size. The 09 October bargain-buying report is historical context, not a new support level. No investor-flow claim follows simply because gold rose while oil fell.
#Gold #XAUUSD #RealYields #DXY #CPI
DXY enters inflation week with an upward trend, yet the three-week view leans bearish with low confidence. What would turn that disagreement into usable evidence?
At 12/10/2026 06:15 UTC, DXY was 102.218, below weekly VWAP 102.239. Price is already above weekly TrendSL 100.329. Source: yfinance:DX-Y.NYB:1m, a timestamped one-minute observation.
The full analysis separates the momentum watch from the weekly structural condition:
-> Why one observation around the weekly average is insufficient.
-> How oil and EUR can complicate the US inflation story.
-> What broker-sample positioning can actually tell us.
A completed weekly close below 100.329 would provide bearish structural confirmation. This condition remains pending; an intraday move is not a completed weekly close.
Read the full analysis on the website:
https://t.co/jgChpmnFxk
---
Intermarket Edge | Institutional Macro & Intermarket Analysis
For informational and educational purposes only. Not financial advice.
DXY W42: An upward trend meets an unconfirmed bearish view.
The three-week assessment leans lower with low confidence, while daily, weekly and monthly trend readings remain upward. That conflict is already present.
At 12/10/2026 06:15 UTC, DXY was 102.218, below weekly VWAP 102.239. Price is already above weekly TrendSL 100.329. Source: yfinance:DX-Y.NYB:1m, a timestamped one-minute observation.
Two conditions matter:
• Sustained trading on the higher side of the weekly average would work against the bearish view. A single observation is insufficient; no weekly-close rule is attached to this momentum watch.
• A completed weekly close below 100.329 would provide bearish structural confirmation. This condition remains pending; an intraday move is not a completed weekly close.
Reuters on 12 October highlighted inflation risk and oil uncertainty around a potential energy ceasefire. Lower oil could ease energy costs if sustained, but additional supply is not confirmed. Check EURUSD and yields before assigning a dollar effect.
ForexFactory, a secondary calendar source retrieved on 12 October, lists CPI on 14 October, retail sales and PPI on 15 October, and a Fed Chair appearance on 16 October. Outcomes are unknown.
Waiting for stronger agreement is reasonable for readers without exposure. Existing bearish positions face an intact upward structure; bullish positions still need resilience after the releases.
The main trap is treating a plausible policy story as an entry signal. Softer inflation could reduce expected tightening without establishing a rate-cut cycle. Relative-rate claims require comparable observations for the other currencies, not just a US release. Euro weakness discussed by Reuters on 09 October remains prior-week context until refreshed. The index can rise because its largest counterpart weakens; that alone does not demonstrate broad USD strength or investor flows. After the releases, reassess price against updated weekly levels instead of extending an early-week observation across the entire analysis horizon.
#DXY #USDollar #CPI #ForexAnalysis #IntermarketAnalysis
DXY enters inflation week with an upward trend, yet the three-week view leans bearish with low confidence. What would turn that disagreement into usable evidence?
At 12/10/2026 06:15 UTC, DXY was 102.218, below weekly VWAP 102.239. Price is already above weekly TrendSL 100.329. Source: yfinance:DX-Y.NYB:1m, a timestamped one-minute observation.
The full analysis separates the momentum watch from the weekly structural condition:
-> Why one observation around the weekly average is insufficient.
-> How oil and EUR can complicate the US inflation story.
-> What broker-sample positioning can actually tell us.
A completed weekly close below 100.329 would provide bearish structural confirmation. This condition remains pending; an intraday move is not a completed weekly close.
Read the full analysis on the website: https://t.co/qen2EAAnHY
https://t.co/jgChpmnFxk
---
Intermarket Edge | Institutional Macro & Intermarket Analysis
For informational and educational purposes only. Not financial advice.
The yen was heading for a fourth weekly decline, yet buying the USDJPY trend still faces a momentum warning. The week had not closed.
At 04:54 UTC on October 9, 2026, USDJPY was 157.811 on MT5 USDJPY.sml:1m. Price 157.81 is below weekly VWAP 158.04. The adverse momentum warning is already active, not a future condition.
Price remains above TrendSL 157.54. Only a completed weekly close below 157.54 would invalidate the bullish structure. That condition is pending; an intraday crossing is insufficient.
Explore the full analysis: https://t.co/DQKRpNow2w
Intermarket Edge | Institutional Macro & Intermarket Analysis
For informational purposes only. Not financial advice.
USDJPY W41 | An uptrend with an active momentum warning
At 04:54 UTC on October 9, 2026, USDJPY was 157.811 on MT5 USDJPY.sml:1m. Price 157.81 is below weekly VWAP 158.04. The adverse momentum warning is already active, not a future condition.
Price remains above TrendSL 157.54. Only a completed weekly close below 157.54 would invalidate the bullish structure. That condition is pending; an intraday crossing is insufficient.
A sustained recovery through the weekly average would prompt reassessment of momentum. This does not require a weekly close. The decision at the snapshot is to stand aside, with a three-week review window.
Japan's August real household spending fell 3.1% YoY but increased 0.1% MoM seasonally adjusted, according to the supplied Mace News headlines. Compare fresh US-Japan yields and dollar behavior; equity weakness alone does not establish yen inflows.
FXSSI Current Ratio collected at 04:54:25 UTC on October 9: 57% Buy / 43% Sell. Collection time, not verified provider observation time. This broker retail sample is not the whole FX market or a standalone entry signal.
The entry trap is treating agreement across trend measures as permission to buy immediately. An intact structure does not resolve the adverse momentum already visible at the snapshot. A weekly structural reference also does not automatically define the right execution stop for every position.
The bullish case would become more coherent if momentum recovered and comparable US-Japan yields supported the same explanation. Continued weakness would instead increase attention on the weekly structural condition. Neither scenario is a forecast with a guaranteed target, and neither has an assigned probability.
Use DXY as a cross-check, remembering that euro-specific weakness can lift the index. The pair and the index need not move identically. For readers without exposure, waiting remains consistent with the framework; a directional view does not require immediate participation.
Educational analysis, not a trade recommendation.
#USDJPY #Yen #DXY #IntermarketAnalysis
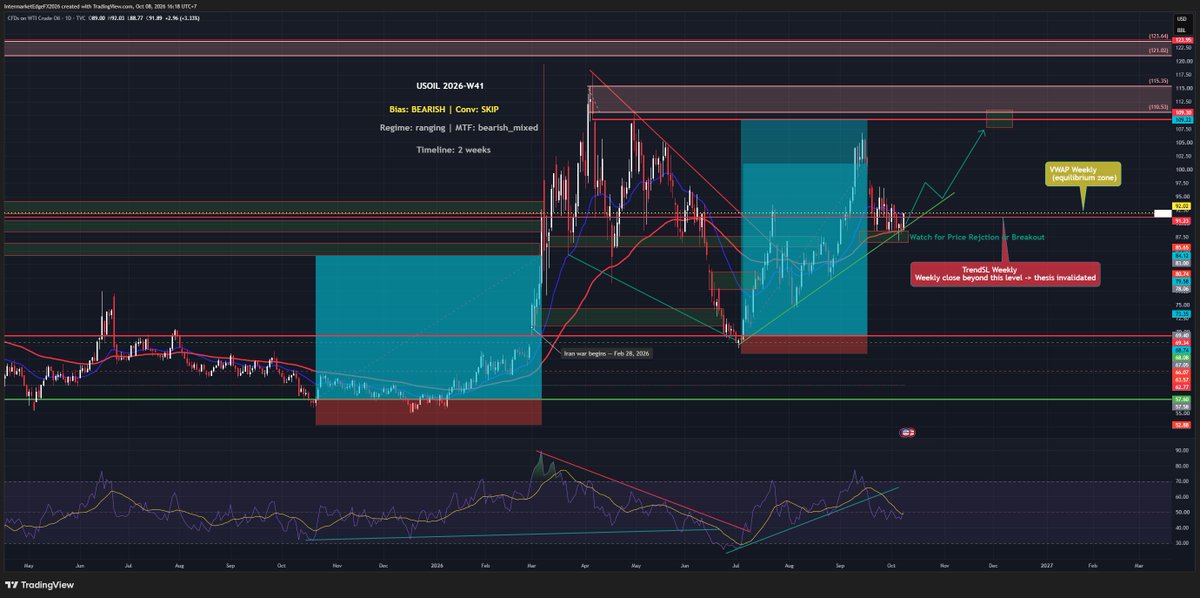
Supply-risk headlines support oil, but the previous rally failed to hold. The more important question is whether price confirms the bearish interpretation.
USOIL was 91.836 at 08:44 UTC on October 8, 2026 (MT5 USOIL.sml:1m), displayed as 91.84. Price is below weekly VWAP 92.02 and already above weekly TrendSL 91.23. The structural conflict with the bearish view is active now, not a future risk.
A completed weekly close below 91.23 would provide bearish structural confirmation for the first time. This is confirmation, not invalidation, and remains pending. An intraday crossing is insufficient.
Read the full analysis for the inventory components, the dollar cross-check and the distinct momentum warning.
https://t.co/Lw8q75W67K
Intermarket Edge | Institutional Macro & Intermarket Analysis
For informational purposes only. Not financial advice.
USOIL W41 | Supply fears, demand doubts, no confirmed short setup
USOIL was 91.836 at 08:44 UTC on October 8, 2026 (MT5 USOIL.sml:1m), displayed as 91.84. Price is below weekly VWAP 92.02 and already above weekly TrendSL 91.23. The structural conflict with the bearish view is active now, not a future risk.
A completed weekly close below 91.23 would provide bearish structural confirmation for the first time. This is confirmation, not invalidation, and remains pending. An intraday crossing is insufficient.
If price sustains above 92.02, momentum would work against the bearish view and call for a short-side risk review. This warning is pending and does not require a weekly close.
Shipping and storm headlines describe supply risks, not quantified outages. Trading Economics, citing EIA for the week ended October 2, reported crude stocks down 3.186 million barrels, Cushing up 0.444 million and gasoline up 0.382 million. The components are mixed. Barchart reported a demand-forecast reduction; no exact revision is asserted here.
Compare fresh dollar moves with oil-specific evidence. A weaker dollar is not another bearish oil signal by itself. The decision is to stand aside over a two-week review horizon while structure and direction disagree. This is a dated broker quote, not an exchange futures settlement.
The entry trap works both ways. A buyer can mistake a disruption concern for confirmed physical losses. A seller can mistake a bearish interpretation for completed technical confirmation. A report of futures turning lower despite the inventory draw is a price response to that same event, not a separate supply-demand shock.
For existing exposure, risk limits matter before any weekly condition is completed. A level used to assess structure is not automatically the correct execution stop for every position. A range also does not establish equal odds of an upward and downward move. Follow actual evidence rather than attaching invented probabilities to the two scenarios.
Educational analysis, not a trade recommendation.
#USOIL #WTI #Energy #IntermarketAnalysis
Softer US data reduced Fed hike expectations, but fiscal risk is still weighing on the euro. Does the downward structure offer a clear entry?
The full analysis separates the momentum warning from weekly structural invalidation, examines French-German spreads, and explains why related fiscal headlines are not independent confirmations.
FXSSI Current Ratio collected at 14:24:09 UTC (21:24:09 GMT+7) on October 7 showed 77% Buy and 23% Sell for EURUSD in its broker retail sample. This is collection time, not a provider observation timestamp. The sample does not represent the entire FX market and is not a standalone entry signal. Its buying skew contrasts with the broader downward trend, but it does not reveal stop locations, leverage or forced liquidation.
https://t.co/YT4vFqa9Dl
Intermarket Edge | Institutional Macro & Intermarket Analysis
For informational purposes only. Not financial advice.
EURUSD W41 | Fiscal pressure, uncertain entry timing
At 14:24 UTC on October 7, 2026, EURUSD was 1.11881 (MT5 EURUSD.sml:1m), below weekly VWAP 1.12167 and weekly TrendSL 1.14682. The broader trend points downward, but positive short-term signals reduce agreement. The bearish view has low conviction; standing aside avoids forcing a fresh entry.
If price sustains above 1.12167, momentum would work against the bearish view and call for a short-side risk review. Only a completed weekly close above 1.14682 would invalidate the bearish structure. Both conditions remain pending at the quoted observation.
FXSSI collected at 14:24:09 UTC on October 7: 77% Buy / 23% Sell. This is collection time. The broker retail sample does not represent the entire FX market or provide a standalone entry signal.
Watch the dollar, comparable US-euro-area yields and French-German sovereign spreads. Related French fiscal headlines are not independent bearish confirmations. ForexFactory lists Fed minutes at 18:00 UTC on October 7 (01:00 GMT+7, October 8), after this snapshot. This secondary calendar is not officially verified. The minutes describe an earlier meeting, not its response to later data.
Three weeks is a review horizon, not a target deadline. Prices are dated references, not live quotes.
The entry trap is assuming that every price below a weekly average is an attractive short. The gap to VWAP is about 28.6 pips. A recovery can challenge timing without overturning the larger structure. Conversely, a favorable headline does not establish that the recovery will last.
A US yield alone cannot prove a bilateral yield advantage. The comparison needs matching maturities, yield definitions and timestamps on both sides. Likewise, retail buying does not reveal leverage or stop locations. Neither observation establishes that forced selling is imminent.
For readers already exposed, personal risk limits still matter before the distant weekly structural threshold. For those without exposure, waiting is an active decision when evidence remains mixed. Follow the actual reaction to new policy information rather than assigning the event a predetermined direction.
Educational analysis, not a trade recommendation.
#EURUSD #FXSSI #DXY #IntermarketAnalysis
Sterling looks stronger against the euro, but what does that establish for GBPUSD?
The full analysis separates relative currency strength, the active momentum warning, and the weekly structural threshold.
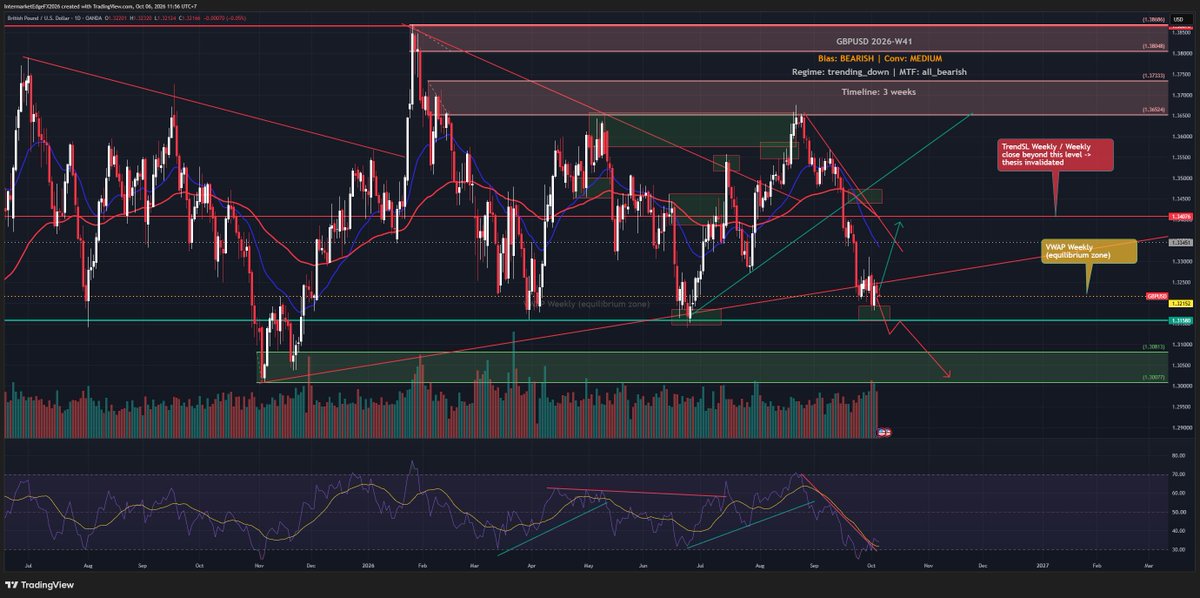
At 04:36 UTC on 06 October 2026, GBPUSD was 1.3228 (MT5 GBPUSD.sml:1m). Price is already above weekly VWAP 1.32152; the warning against bearish momentum is active now. Price is below weekly TrendSL 1.34076.
Read the analysis: https://t.co/rlhjphPgmk
Intermarket Edge | Institutional Macro & Intermarket Analysis
For informational purposes only. Not financial advice.
GBPUSD W41 | A bearish structure with an active momentum warning
Sterling strength against the euro does not establish strength against USD. Amundi's more favorable GBP view also came alongside a positive dollar view.
At 04:36 UTC on 06 October 2026, GBPUSD was 1.3228 (MT5 GBPUSD.sml:1m). Price is already above weekly VWAP 1.32152; the warning against bearish momentum is active now. Price is below weekly TrendSL 1.34076.
Only a completed weekly close above 1.34076 would invalidate the bearish structure. That condition remains pending; an intraday touch is insufficient.
The outlook remains bearish with medium conviction over a three-week review horizon. Timing is less clear. Existing shorts warrant a risk review now; a new position can wait for stronger agreement. Compare fresh dollar moves and matching UK-US yield observations rather than inferring the pair's direction from EURGBP alone.
ForexFactory lists FOMC minutes for October 7 and Bailey remarks for October 8 on its UTC calendar. These are secondary-source listings, not officially verified schedules. Prices above are dated references, not live quotes.
FXSSI collected on October 6 at 04:36:18 UTC: 69% Buy / 31% Sell for GBPUSD. Collection time, not provider observation time. This broker retail sample does not represent the entire FX market and is not a standalone entry signal.
The entry trap is to treat a correct view of the larger trend as permission to sell immediately. A price above its weighted average does not prove buying volume dominates, but it does establish that the momentum warning is already present. Waiting for this warning to appear later would misread the current observation.
For a recovery scenario, watch whether sterling maintains its strength while the dollar softens or the comparable yield picture becomes more supportive. For renewed downward pressure, look for price evidence and a dollar response that agree. These are conditions to observe, not claims that either sequence is underway.
The three-week horizon is a review window, not a deadline for a price target. Personal risk limits matter before a distant structural reference is reached. A headline about one asset manager cannot establish market-wide capital flows or substitute for the missing half of a currency comparison.
Educational analysis, not a trade recommendation.
#GBPUSD #Sterling #DXY #IntermarketAnalysis
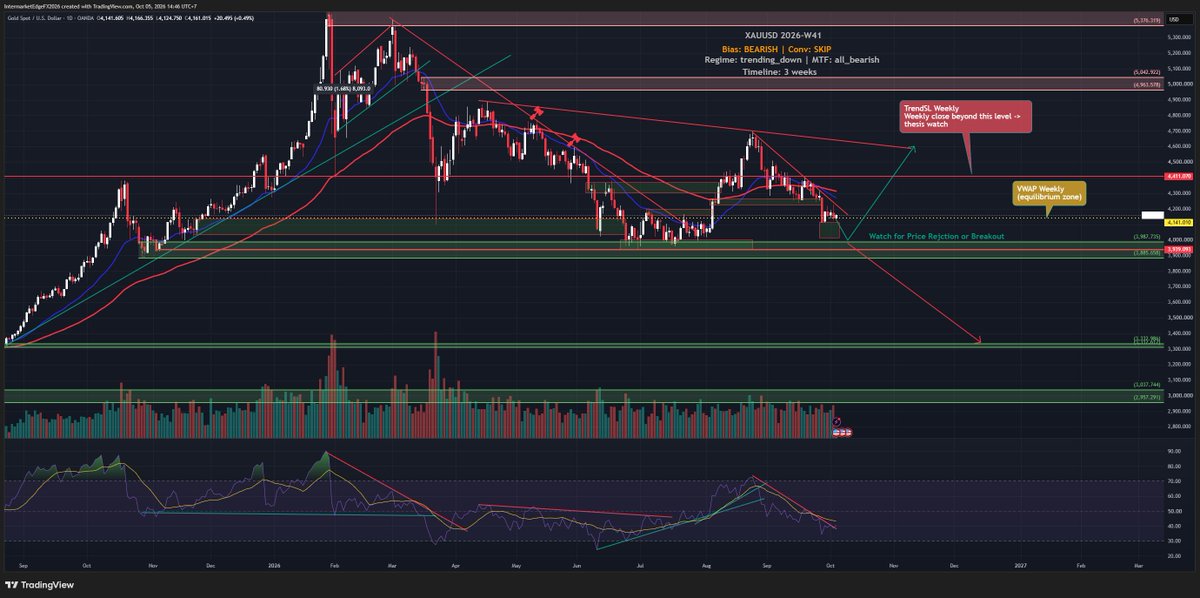
Softer US hiring has reduced expectations of another Fed increase, but gold's weekly structure has not reversed. The opportunity and the risk lie in the gap between those two observations.
At 07:15 UTC on 05 October 2026, gold was 4135.09 USD per ounce (MT5, XAUUSD.sml, 1-minute feed). It was below weekly VWAP 4141.01 and weekly TrendSL 4411.07.
The full analysis examines:
-> Why a reaction to jobs news is not automatically a trend change.
-> How a momentum warning differs from weekly structural invalidation.
-> What broker-sample retail positioning can and cannot establish.
-> Which dollar and yield observations would support each scenario.
Read the full analysis for the weekly-close condition and the entry-timing trap when a short-term price signal disagrees with the broader trend.
https://t.co/vx2z7ejQTp
---
Intermarket Edge | Institutional Macro & Intermarket Analysis
For informational purposes only. Not financial advice.
Softer September US hiring reduced expectations of an October Fed increase, supporting gold at one point in Monday's trading. A separate Reuters update reported pressure from a firmer dollar. Those observations describe different moments, not a confirmed reversal or the latest market quote.
At 07:15 UTC on 05 October 2026, gold was 4135.09 USD per ounce (MT5, XAUUSD.sml, 1-minute feed). It was below weekly VWAP 4141.01 and weekly TrendSL 4411.07. The downward trend assessment across daily, weekly and monthly charts conflicts with a positive short-term price signal. The decision is to stand aside while that disagreement remains unresolved.
Two conditions have different meanings:
• If price sustains above 4141.01, near-term momentum would work against the bearish view. VWAP is a dynamic reference, not structural invalidation.
• A completed weekly close above 4411.07 would invalidate the bearish structure. This remains pending; an intraday touch is insufficient.
For readers without a position, waiting avoids forcing an entry into conflicting evidence. Readers already holding exposure should assess those conditions against their own risk limits. Reduced odds of another hike do not establish a rate-cut cycle, and a downward trend does not guarantee a favorable short entry.
FXSSI on 05 October shows 65% of sampled retail accounts long gold. This broker sample does not represent the entire market and is not a standalone entry signal. It suggests one-sided exposure within that sample; it cannot establish the scarcity of buyers, the location of stops or forced selling.
The intermarket question is whether fresh dollar and real-yield moves confirm the same story as gold. A weaker dollar and lower real yields would support a recovery scenario; renewed strength in either can act as a headwind. These are conditions to check with matched timestamps, not claims that a particular combination has already occurred. The trap is to turn a plausible explanation into an entry before price and the broader evidence agree.
ForexFactory lists FOMC minutes for 07 October. That secondary calendar entry concerns an earlier meeting, not a fresh committee response to the latest jobs data.
#XAUUSD #Gold #FOMC #RealYields #DXY #IntermarketAnalysis