For our subscribers relying on DTN continuous contracts, we have added a new rollover calendar for the main US markets, incl. front-month symbols for Rithmic, CQG & IBKR.
https://t.co/0gM7T7H2v0
Remember to roll US indexes to the M5 contract today, before the cash market opens.
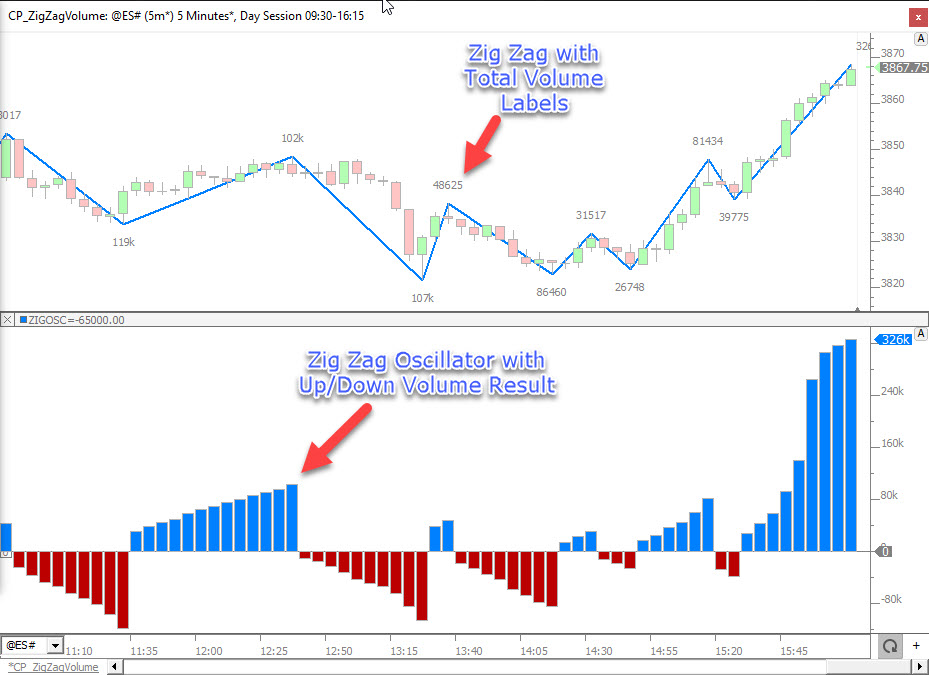
New forum topic explains how the volume (and delta) of pivot bars are handled when computing the volume numbers of each leg of Zig Zag and Zig Zag Oscillator.
https://t.co/reeHwKsU3f
New forum post explains how to download and chart the maximum amount of data for Yearly, Quarterly, Monthly, Weekly, or Daily bars. In this case we are focused on @nq# and data downloaded thru IQFEED or DTNMA.
We are working to resolve connectivity issues with our web site. We hope to have this fixed very soon. We apologize for any inconvenience this may cause.
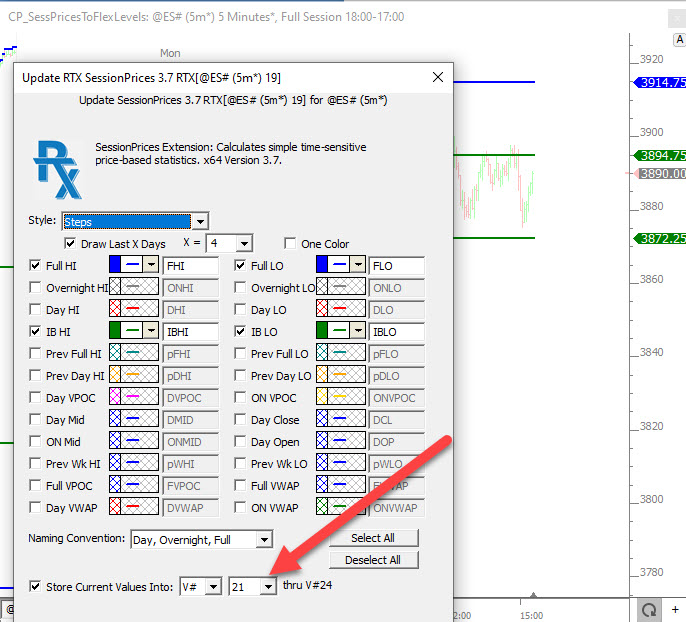
This forum post will explain how to export the key prices provided by the SessionPrices (RTX) indicator to the FlexLevels csv file via Reference Lines. https://t.co/H815OGiEyf
This forum post explains how to create a variable duration, day session, opening range high and low that works on any combination of symbol, session, and periodicity.
https://t.co/oyDKqmGIat
New forum post explains how to plot day session (RTH) POC, VAH, and VAL on a full session chart, and extend those values until touched by future day session bar.
https://t.co/6yEyjgdPLR
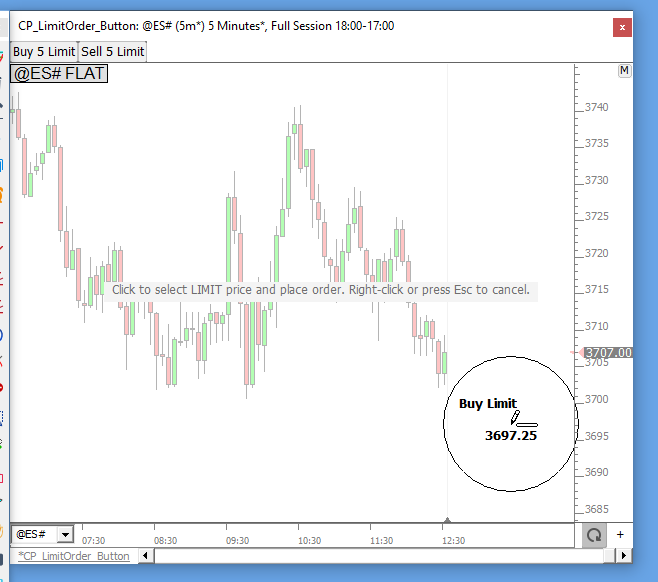
New forum post details how to submit limit orders from chart Button . Simply click on the button, then click on the price you would like the limit order placed.
https://t.co/q3xmL0Pmam
@SabuShibin DTNMA is HIGHLY recommended. Additional $15/mo but gives you very complete and reliable historical data when using a brokerage feed for the live data.
If you are having an issue with missing data in your TPO Charts, please try setting the config variable MaxAllocPerPriceRange to 200 and then close and reopen the TPO Chart. This is related to the extreme move / range of previous trading session.
3-Bar Gaps...
This forum post demonstrates how to identify "3 Bar Gaps" in which the high of one bar is below the low of 2 bars before it (pink) ...or, the low of one bar is above the high of 2 bars previous (blue).
https://t.co/SD6Uajd1MN
Where does price go based on where price opens?
New Homework RTX Indicator computes and accumulates price-based statistic on daily data. HW is focused on percentages of touching or closing above key prices based on the where price opens the day session.
https://t.co/9ydfnR01Sv
Cumulative Tick in Candle Form. The latest reply to this forum post shows how to plot the Cumulative Tick in candle format using the Custom Candle indicator...providing the open, high and low in addition to the closing price of each bar.
https://t.co/StUZm8KuvJ
Introducing VolumeScopeStats (RTX). This indicator computes volume-at-price stats that are sensitive to both time of day, and periodicity. VSS can feed PVP and TradeDots to identify significant volume/delta-at-price values any time of day. Watch video!
https://t.co/4wciu9tfaW
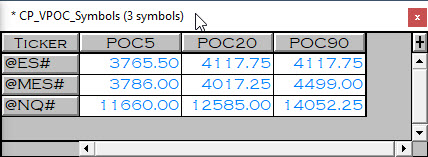
This forum post will explain how to export the VPOC of various durations (5 days, 20 days, and 90 days) on multiple symbols, to an Excel spreadsheet. And in our example, we will focus on these VPOCs being built from only day session data.
https://t.co/49WJW6nw8l