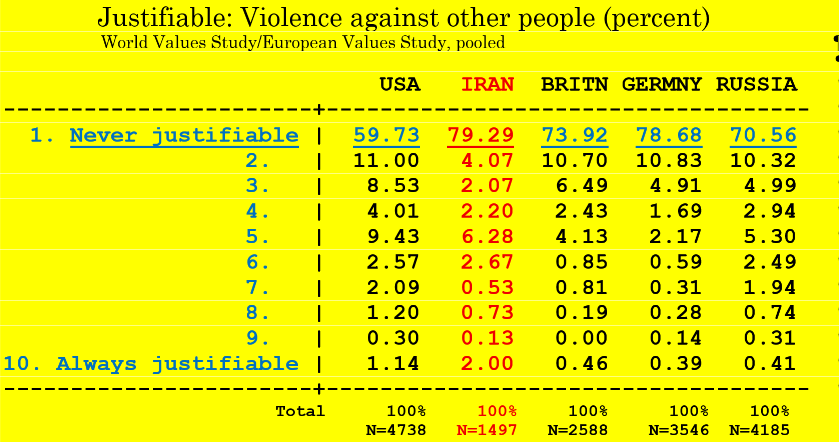
TOPIC: Iran
QUESTION: Is violence against other people ever justified? (1=Never to 10=Always)
FINDING: Iran, Britain, Germany & even Russia almost always reject violence (≈70% to 80%) but the USA (≈60%) is more accepting
SOURCE: Academic surveys, N≈1500+ each
CONFIDENCE: Moderate (only single item measurement)
#Iran #war #Trump #America #USA #Israel #MiddleEastCrisis #InternationalRelations #StrategicAnalysis #GlobalPolitics
TOPIC: Iran
MEASURE: education (detail & years)
FINDING: Iran at western levels -- a year or two less than USA, half a year more than Britain
SOURCE: academic surveys, N≈5000 each
@DrDominicNg A better analysis for point #1 would be multivariate regression (if the data collection design allows it): brain clearance = b1*frequency of norepinephrine pulses + b2* total sleep time+b3* REM sleep+b4* deep sleep duration + intercept. (estimated by OLS).
Harm from global warming? THE FACTS, PART 1: BELIEFS. Many Americans believe global warming has made their own life worse, most think has made no difference, and only a few think warming has made their life better. But the Trump administration now proposes to repeal the Obama government'sscientific declaration on the dangers of greenhouse gases. That would invalidate most of the EPA's climate regulations (Politico 07/29/2025).
The question:
Has GLOBAL WARMING made your quality of life…
7% Much worse!!
29% Worse
52% No difference
8% Better
4% Much better!!
---
100% (N= 8,988) USA 2019-2021
Moreover, most believe the majority of Americans have had much the same experience:
For the MAJORITY OF PEOPLE in this country has global warming made things…
9% Much worse!!
35% Worse
45% No difference
7% Better
4% Much better!!
---
100% (N= 8,982) USA 2019-2021
The correlation between answers to the two questions is r=.75 and they make a reliable scale (reliability alpha=.83) that fits the classical measurement model.
UPCOMING: Harm from Global Warming PART 2: Ideology and Politics
DATA: See https://t.co/DvUlQwbfWg
METHODS: See https://t.co/6iEuqKAeoS
AUTHOR: Sociologist. Academic survey researcher, heavy duty quant. Cambridge BA, Berkeley PhD. Previously Senior Fellow and Director of the International Survey Project, Institute of Advanced Studies, The Australian National University and Professorial Fellow, Melbourne Institute of Applied Economic and Social Research, the University of Melbourne. 5 books; 140+ papers in the American Sociological Review, the American Journal of Sociology, Nature Biotechnology, the British Journal of Sociology, the American Political Science Review, etc. World Association for Public Opinion Research, Worcester Prize, 2003; American Association for the Advancement of Science, Prize for Behavioral Science Research, 1977. Cited in the academic literature 10,000+ times.
Harm from global warming? THE FACTS, PART 1: BELIEFS. Many Americans believe global warming has made their own life worse, most think has made no difference, and only a few think warming has made their life better. But the Trump administration now proposes to repeal the Obama government'sscientific declaration on the dangers of greenhouse gases. That would invalidate most of the EPA's climate regulations (Politico 07/29/2025).
The question:
Has GLOBAL WARMING made your quality of life…
7% Much worse!!
29% Worse
52% No difference
8% Better
4% Much better!!
---
100% (N= 8,988) USA 2019-2021
Moreover, most believe the majority of Americans have had much the same experience:
For the MAJORITY OF PEOPLE in this country has global warming made things…
9% Much worse!!
35% Worse
45% No difference
7% Better
4% Much better!!
---
100% (N= 8,982) USA 2019-2021
The correlation between answers to the two questions is r=.75 and they make a reliable scale (reliability alpha=.83) that fits the classical measurement model.
UPCOMING: Harm from a Century's Worth of Global Warming PART 2: Ideology and Politics
DATA: See https://t.co/DvUlQwbfWg
METHODS: See https://t.co/6iEuqKAeoS
AUTHOR: Sociologist. Academic survey researcher, heavy duty quant. Cambridge BA, Berkeley PhD. Previously Senior Fellow and Director of the International Survey Project, Institute of Advanced Studies, The Australian National University and Professorial Fellow, Melbourne Institute of Applied Economic and Social Research, the University of Melbourne. 5 books; 140+ papers in the American Sociological Review, the American Journal of Sociology, Nature Biotechnology, the British Journal of Sociology, the American Political Science Review, etc. World Association for Public Opinion Research, Worcester Prize, 2003; American Association for the Advancement of Science, Prize for Behavioral Science Research, 1977. Cited in the academic literature 10,000+ times.
[reposted with minor additions from July 2024]
Musk needs TRUST ONLY IN 2 OR 3 CONSTITUNCIES to break the two-party deadlock, assuming things otherwise stay as they are now. EXAMPLE: Suppose in the Senate the Democrats have 49 votes and the Republicans 48 and Musk's new party has 3. Then if Musk votes with the Democrats, they win; and if Musk instead votes with the Republicans, they win. So Musk needs only to find voters in his 2 or 3 constituencies to trust him, regardless of what voters in the rest of the country think, and then the two-party deadlock is broken!
Elon Musk's new political party might actually seize the balance of power after the next election! Since Republicans and Democrats are so evenly balanced, just 2 or 3 seats might do it. PRACTICAL IMPLICATION: Musk should target several now Democratic seats (not only now Republican seats), hoping neither old party gets a majority on its own. COMPARISON: ReformUK's recent success in England. #Musk #election2026 #ReformUK
AAPOR conference today: "US Presidential Elections: Ignoring the Elephants in the Room" Point #3: Perceptions of MERITOCRACY (=good economic opportunities). Politically important! 14 national samples, 2016-2022. N= 10,000+. OLS all else equal.
Presentation at the 80th Annual Conference of the American Association for Public Opinion Research, St. Louis May 14–16, 2025
Session: Hearts, Minds, and Wallets: What Really Drove the Vote in 2024?
Jonathan Kelley** & MDR Evans*
**Director, International Social Science Survey
*Professor Emeritx, University of Nevada
CORRELATIONS (real respondents only) (scale α=.92) (obs=8,961)
meritAnyQ | 1.00
meritSkillQ | 0.68 1.00
meritEffortQ | 0.72 0.77 1.00
poorStdQ | 0.72 0.57 0.63 1.00
poorFdmQ | 0.63 0.56 0.57 0.67 1.00
poorImpQ | 0.69 0.56 0.61 0.76 0.65 1.00
CORRELATIONS WITH CRITERION VARIABLES
AgeQ | 0.03 0.04 0.03 0.00 0.04 0.00
MaleQ | 0.13 0.12 0.14 0.12 0.09 0.13
eBlackQ | 0.05 0.03 0.04 0.05 0.03 0.05
pntEdQ | 0.01 0.02 0.04 0.00 -0.01 0.00
pntDem8 | -0.12 -0.11 -0.12 -0.12 -0.11 -0.12
rBelief9 | 0.28 0.23 0.24 0.29 0.23 0.27
StatusQ8 | 0.08 0.09 0.10 0.08 0.06 0.07
lnFamIncQ | 0.19 0.17 0.20 0.20 0.16 0.18
Means | Mean SD Min Max
-------------+-------------------------
meritAnyQ | 60 27 0 100
meritSkillQ | 65 25 0 100
meritEffortQ | 62 26 0 100
poorStdQ | 61 28 0 100
poorFdmQ | 65 26 0 100
poorImpQ | 58 27 0 100
-------------+-------------------------
Scale: (α=.92)
ROLE PLAYER QUESTION: A few people are answering the survey while pretending to be someone else, playing a role instead of giving their own views. How about you?
66% Almost always gave my OWN TRUE VIEWS
13% Mostly gave my own true views, but sometimes not
11% About half and half
3% Mostly role playing
1% Almost all role playing, hardly ever my real views
7% No answer (including breakoffs)
----
100% (N= 15,594)
See: “In Recent Surveys Many Respondents Spontaneously Role-play, Pretending to Be Someone Else Instead of Giving Their Own True Views, Creating Dangerous Biases That Distort Even Multivariate Analyses: USA 2016-2020, N=17000+.” doi:10.31235/osf.io/ue6n2.
FOCAL VARIABLE
Vote Republican, lean Republican, mixed feelings, lean Democrat, vote Democrat (0-1; in some analyses 1-0)
DEMOGRAPHICS
Male (1-0)
Black (1-0)
Hispanic (1-0)
Age (years)
FAMILY BACKGROUND
Culture: Books in home age 14 (ln#)
Parents split up by age 14 (1-0)
Parents' education (years)
Parents: Professional=1...farmer=0
Parents Democratic (1-0)
Church attendance at age 14 (#)
RELIGION
Religion: belief, importance(α=.95)
Church going (times per year)
CURRENT SITUATION & SOCIOECONOMICS
Culture: Books in home now (ln#)
Education (years of school & uni)
High status occupation (1-0)
Married (1-0)
Family income (ln $1000s)
PERCEPTIONS, ATTITUDES
Opportunities, meritocracy (α=.92)
Proud to be American (1-0)
Too much income inequality (α=.92)
AAPOR conference today: "US Presidential Elections: Ignoring the Elephants in the Room" Point 2: For respondents "pretending to be someone else" religious belief was irrelevant |β=.05| but not for real respondents |β=.21|. 14 national samples, 2016-2022. N=4,000+ and 10,000+. OLS all else equal.
• ROLE PLAYER QUESTION: A few people are answering the survey while pretending to be someone else, playing a role instead of giving their own views. How about you?
o 66% Almost always gave my OWN TRUE VIEWS
o 13% Mostly gave my own true views, but sometimes not
o 11% About half and half
o 3% Mostly role playing
o 1% Almost all role playing, hardly ever my real views
o 7% No answer (including breakoffs)
o ----
o 100% (N= 15,594)
See: “In Recent Surveys Many Respondents Spontaneously Role-play, Pretending to Be Someone Else Instead of Giving Their Own True Views, Creating Dangerous Biases That Distort Even Multivariate Analyses: USA 2016-2020, N=17000+.” doi:10.31235/osf.io/ue6n2.
FOCAL VARIABLE
Vote Republican, lean Republican, mixed feelings, lean Democrat, vote Democrat (0-1; in some analyses 1-0)
DEMOGRAPHICS
Male (1-0)
Black (1-0)
Hispanic (1-0)
Age (years)
FAMILY BACKGROUND
Culture: Books in home age 14 (ln#)
Parents split up by age 14 (1-0)
Parents' education (years)
Parents: Professional=1...farmer=0
Parents Democratic (1-0)
Church attendance at age 14 (#)
RELIGION
Religion: belief, importance(α=.95)
Church going (times per year)
CURRENT SITUATION & SOCIOECONOMICS
Culture: Books in home now (ln#)
Education (years of school & uni)
High status occupation (1-0)
Married (1-0)
Family income (ln $1000s)
PERCEPTIONS, ATTITUDES
Opportunities, meritocracy (α=.92)
Proud to be American (1-0)
Too much income inequality (α=.92)
AAPOR conference today: "US Presidential Elections:Ignoring the Elephants in the Room" Point 1: 78% of respondents who answered the survey while pretending to be someone else said their parents were Democratic compared to only 39% of real respondents (N=4,000+ and 10,000+). 14 US national samples, 2016-2022. Predicted values from OLS, all else equal.
• Role player question: A few people are answering the survey while pretending to be someone else, playing a role instead of giving their own views. How about you?
o 66% Almost always gave my OWN TRUE VIEWS
o 13% Mostly gave my own true views, but sometimes not
o 11% About half and half
o 3% Mostly role playing
o 1% Almost all role playing, hardly ever my real views
o 7% No answer (including breakoffs)
o ----
o 100% (N= 15,594)
See: “In Recent Surveys Many Respondents Spontaneously Role-play, Pretending to Be Someone Else Instead of Giving Their Own True Views, Creating Dangerous Biases That Distort Even Multivariate Analyses: USA 2016-2020, N=17000+.” doi:10.31235/osf.io/ue6n2.
Focal variable
Vote Republican, lean Republican, mixed feelings, lean Democrat, vote Democrat (1-0)
Demographics
Male (1-0)
Black (1-0)
Hispanic (1-0)
Age (years)
Family background
Culture: Books in home age 14 (ln#)
Parents split up by age 14 (1-0)
Parents' education (years)
Parents: Professional=1...farmer=0
Parents Democratic (1-0)
Church attendance at age 14 (#)
Religion: belief, importance(α=.95)
Church going (times per year)
Current situation & socioeconomics
Culture: Books in home now (ln#)
Education (years of school & uni)
High status occupation (1-0)
Married (1-0)
Family income (ln $1000s)
Perceptions, attitudes
Opportunities, meritocracy (α=.92)
Proud to be American (1-0)
Too much income inequality (α=.92)
Teens learn more, miss less if school starts later. An experiment in England’s rustbelt north boldly reset school start times for teens to 10 AM for 2 years. Student absence dropped by more than 50%. Academic performance rose by around 20% of the national benchmark. The next year, the school reverted to a traditional 8:50 AM start. Absenteeism rose by 30% and academic performance trended down.
That was far away, but if English employers and families can adapt seamlessly to a 10 AM start, so can Americans!
See "Is 8:30 a.m. Still Too Early to Start School? A 10:00 a.m. School Start Time Improves Health and Performance of Students Aged 13–16" Front. Hum. Neurosci., 07 December 2017. Paul Kelley, Steven W. Lockley, Jonathan Kelley & MDR. Evans https://t.co/H330qqxwGl
Black Americans' perceptions of their own social standing show no signs of "structural discrimination". Even Blacks from very modest families think they do well. For instance:
In our society there are some social groups which are higher and some which are lower. . . Where do you think you are now on this scale?
High, top . . 100
90
80
70
60
50
40
30
20
10
Low, bottom . . 0
Results (quadratic fit; N= 11,314), International Social Science Survey, USA 2020-2022
There have been two dimensions in American politics for generations, one economic and the other cultural/social:
AMERICAN ASSOCIATION FOR PUBLIC OPINION RESEARCH
PROCEEDINGS OF THE TWENTY-THIRD
ANNUAL CONFERENCE
SECOND ANNUAL STUDENT PAPER COMPETITION
Chairman: William J. Paisley, Stanford University
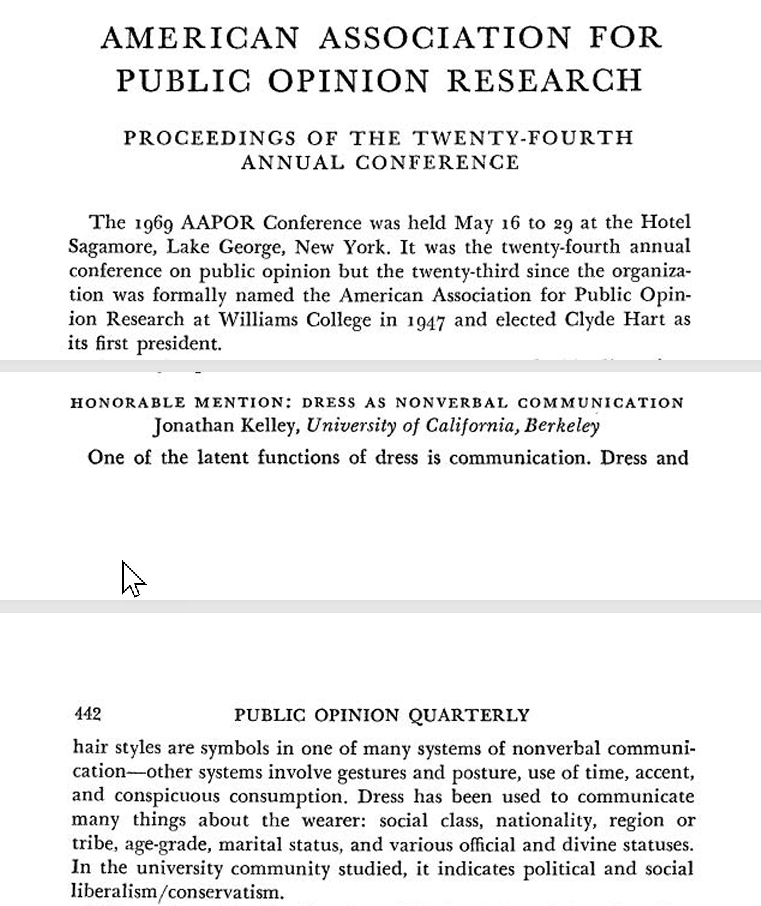
HONORABLE MENTION: THE DIMENSIONS OF POLITICS
Jonathan Kelley, University of California, Berkeley
Political issues and ideologies fall along not one liberal-conservative dimension but along two distinct dimensions, one economic and one cultural. Attitudes toward the proper distribution of wealth underlie the economic dimension and find their expression in attitudes toward business and labor, taxes, private ownership, and socialism. Commitment to parochial small town traditions underlies the cultural dimension. Cultural conservatives emphathize only within a narrow range; people and norms coming from a different class, religion, language, or culture are rejected and met with hostility or outright violence. The specific issues involved in cultural conservatism vary from society to society. In India language, Moslems, and cows are important while in the United States religious traditions, Jews, Negroes, and foreigners are salient.
This theory is supported by a factor analysis of thirty-five political attitude scales. In these data, kindly loaned by Herbert McClosky, two major and three minor factors emerge. Cultural liberalism-conservatism explains more of the common variance than any other dimension, closely followed by economic liberalism-conservatism. Economic conservatism follows expected class lines while cultural conservatism decreases with increasing education. Cultural conservatism is strongly associated with a feeling that the world is cruel and hostile and with psychological rigidity, perhaps because traditional culture is in fact threatened and a certain rigidity helps to withstand these threats.
This theory suggests that the current student radicalism may arise from different resolutions of a conflict between cultural liberalism and economic conservatism. The culturally liberal but economically conservative fathers of this generation of students should experience conflict over many welfare and humanitarian issues, favoring the goals but deploring the means. They resolved the conflict largely in the direction of their economic conservatism. The sons, more secure economically, resolve the conflict largely in favor of their dominant cultural liberalism. A similar conflict, prevalent in the lower class and exploited by conservative politicians, seems to exist between cultural conservatism and economic liberalism.
PLEASE COMMENT on our new project: Religion, redistribution and de Tocqueville's "depraved taste for equality" in the US, UK, and India.
1. PURPOSE. Discover the effects of denominational differences (Catholic, Protestant, Atheist, Hindu, Muslim) and differences in belief (secular vs devout); education (university vs secondary school); age and sex; politics (Democrat, Labour, and Congress vs Republican, Conservative, and BJP); and perceptions of the economy (opportunity & meritocracy vs privilege and discrimination) on attitudes toward redistribution and inequality.
2. CONTEXT. Redistribution, inequality, and religion are key political cleavages in many societies, past and present.
3. METHODS. Multivariate statistical analyses of individual level survey data Baseline: Simple linear models predicting redistribution attitudes (5 item scale, alpha reliability >.85 for the US) from religion, education, age, sex, politics and perceptions of the economy, separately for each nation. Exploration: Multiplicative interactions (initially one at a time) with denominational differences, differences in belief, education, politics, and perceptions of the economy.
4. DATA. International Social Science Survey: Family 2024-2025 for the USA (in progress; N= 1200+). UK (N=500+) and India (N=1200+) scheduled for January 2025.
5. VARIABLES. Father's occupational status & respondent's occupational status (8+ vertical occupational status categories recoded from ISCO); education of respondent and parents, income; the usual demographics. Religious denomination and attendance in childhood and the present. Religious belief (5 item scale from the ASR). Perceptions of the economy (highly reliable 5 item scale). The usual demographic and background variables.
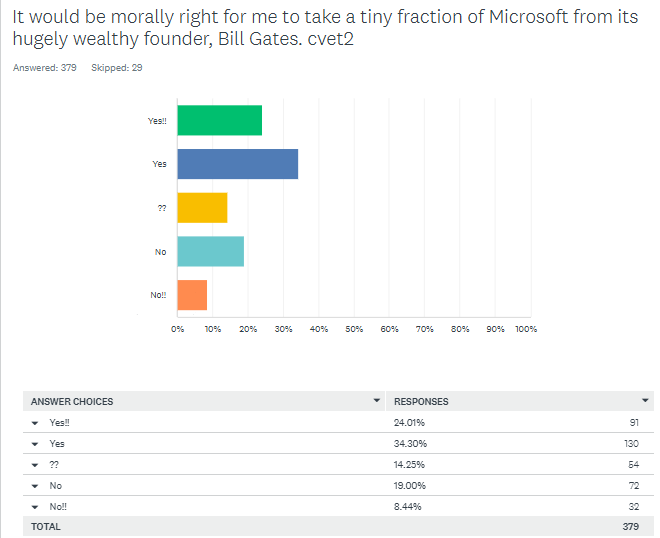
Focal are four novel items invented for this survey measuring PERSONAL morality (example: "It would be morally right for me to take a tiny fraction of Microsoft from its hugely wealthy founder, Bill Gates". Answer categories: "Yes!!, Yes, ??, No, No!! ") and (asked far apart in the survey) measuring GOVERNMENT moral license (example: "Should the government take 10% of Microsoft from its insanely wealthy founder, Bill Gates, and redistribute it to poor Americans?")
6. RESULTS. So far we have to hand only the first wave of the US survey (frequencies only; multivariate analyses yet to come). Consistent with de Tocqueville's pessimistic account of 1830s America, a majority of Americans support redistribution in general (5 item scale known to be reliable in many nations).
Strikingly on our new questions, a narrow majority say it would be moral for them to personally take "a tiny fraction of Microsoft from Bill Gates" and also "a hundredth of Elon Musk's vast wealth for myself ". A larger majority say it would be OK for the government to do the same. All this sounds eerily like de Tocqueville's view of America in the 1830s. How (if at all) this links to religion remains to be explored.
7. IMPLICATIONS. de Tocqueville's analysis of the 1830s US is a classic in sociology and political science. How it applies (if at all) to the modern world is of great interest to the social sciences in general, and recent elections in the US, UK, and India in particular.
This BENEFITS Americans: 2 °C global warming is like moving from Virginia to North Carolina or generally ~180 miles south, better winters outweighing worse summers. Social Indicators Research doi 10.1007/s11205-016-1251-3 Peer-reviewed multivariate research combining a US national survey (N = 2295) and standard NOAA data on actual month-by-month temperatures throughout the US over many years. We measure outcomes by direct survey questions on health and wellbeing and adjust for pre-existing differences in education, occupational standing, income and other relevant characteristics using conventional multivariate OLS methods.
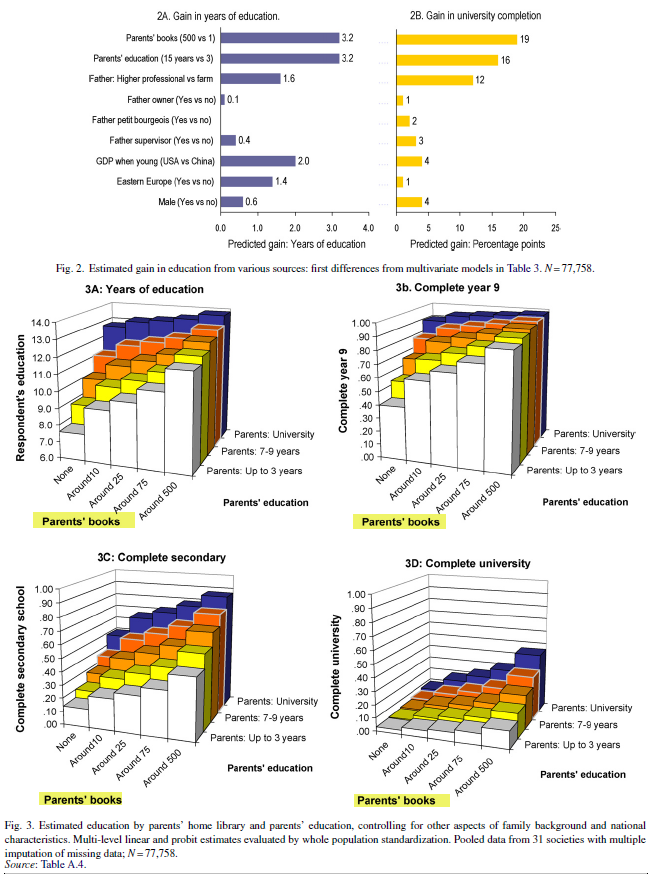
Yes! Children growing up in homes with many books get 3 years more schooling than children from bookless homes, independent of their parents’ education, occupation, and class. This is as great an advantage as having university educated rather than unschooled parents, and twice the advantage of having a professional rather than an unskilled father. It holds equally in rich nations and in poor; in the past and in the present; under Communism, capitalism, and Apartheid; and most strongly in China. Data are from representative national samples in 27 nations, with over 70,000 cases, analyzed using multi-level linear and probit models with multiple imputation of missing data
SEE: Evans, M.D.R., Jonathan Kelley, Joanna Sikora, and Donald J. Treiman. 2010. “Family Scholarly Culture and Educational Success: Evidence From 27 Nations." Research in Social Stratification and Mobility 28(2):171-197
@CarlSassenrath@TheBetterPath_ Yes that was about university students. But they respond just like the general population -- the main difference is that more are evening chronotypes than in the general population. Most of the references in the study are general population and they tell the same story.


![IsssSurvey's tweet photo. Harm from global warming? THE FACTS, PART 1: BELIEFS. Many Americans believe global warming has made their own life worse, most think has made no difference, and only a few think warming has made their life better. But the Trump administration now proposes to repeal the Obama government'sscientific declaration on the dangers of greenhouse gases. That would invalidate most of the EPA's climate regulations (Politico 07/29/2025).
The question:
Has GLOBAL WARMING made your quality of life…
7% Much worse!!
29% Worse
52% No difference
8% Better
4% Much better!!
---
100% (N= 8,988) USA 2019-2021
Moreover, most believe the majority of Americans have had much the same experience:
For the MAJORITY OF PEOPLE in this country has global warming made things…
9% Much worse!!
35% Worse
45% No difference
7% Better
4% Much better!!
---
100% (N= 8,982) USA 2019-2021
The correlation between answers to the two questions is r=.75 and they make a reliable scale (reliability alpha=.83) that fits the classical measurement model.
UPCOMING: Harm from a Century's Worth of Global Warming PART 2: Ideology and Politics
DATA: See https://t.co/DvUlQwbfWg
METHODS: See https://t.co/6iEuqKAeoS
AUTHOR: Sociologist. Academic survey researcher, heavy duty quant. Cambridge BA, Berkeley PhD. Previously Senior Fellow and Director of the International Survey Project, Institute of Advanced Studies, The Australian National University and Professorial Fellow, Melbourne Institute of Applied Economic and Social Research, the University of Melbourne. 5 books; 140+ papers in the American Sociological Review, the American Journal of Sociology, Nature Biotechnology, the British Journal of Sociology, the American Political Science Review, etc. World Association for Public Opinion Research, Worcester Prize, 2003; American Association for the Advancement of Science, Prize for Behavioral Science Research, 1977. Cited in the academic literature 10,000+ times.
[reposted with minor additions from July 2024]](https://pbs.twimg.com/media/GxExSwYW8AA4c-E.png)