In this #VizOfTheDay by @pyonpyon_tab, explore the evolution of diamond-cut designs across centuries through a timeline featuring geometric silhouettes and historical sequencing.
Check out the viz on Tableau Public: https://t.co/LEJVbE4xND
🚨#B2VB Week 10: Build a Heatmap
Let's look at ocean conservation trends! This week we are exploring sea turtle sightings and strandings data from Canada.
To Join: Build your viz, Post with #B2VB, Tag us & submit!
🔗Data: https://t.co/JXG7Wg2Nbr
🚨 #B2VB Week 9: Build a Scatterplot
Where is everyone traveling? This week we're exploring global tourism trends and focusing on finding the relationship between visitor volume and spending.
✅Build your viz ✅Post with #B2VB ✅Tag us & submit!
🔗Data: https://t.co/N2rGNTCH2H
🚨 #B2VB Week 8: Visualizing Rank
TC26 is right around the corner! This week we are ranking breweries within a few miles of the San Diego Convention Center.
To Join: ✅ Build your viz ✅ Post with #B2VB ✅ Tag us & submit!
🔗 Data: https://t.co/vKOUVChcdU
🚨 #B2VB Week 7: Making Insights Clear
Charts are good, but stories are better! This week we are focusing on storytelling using US data center statistics.
To Join: ✅Build your viz ✅Post with #B2VB ✅Tag us & submit!
🔗Data: https://t.co/2ODX2HK28Z
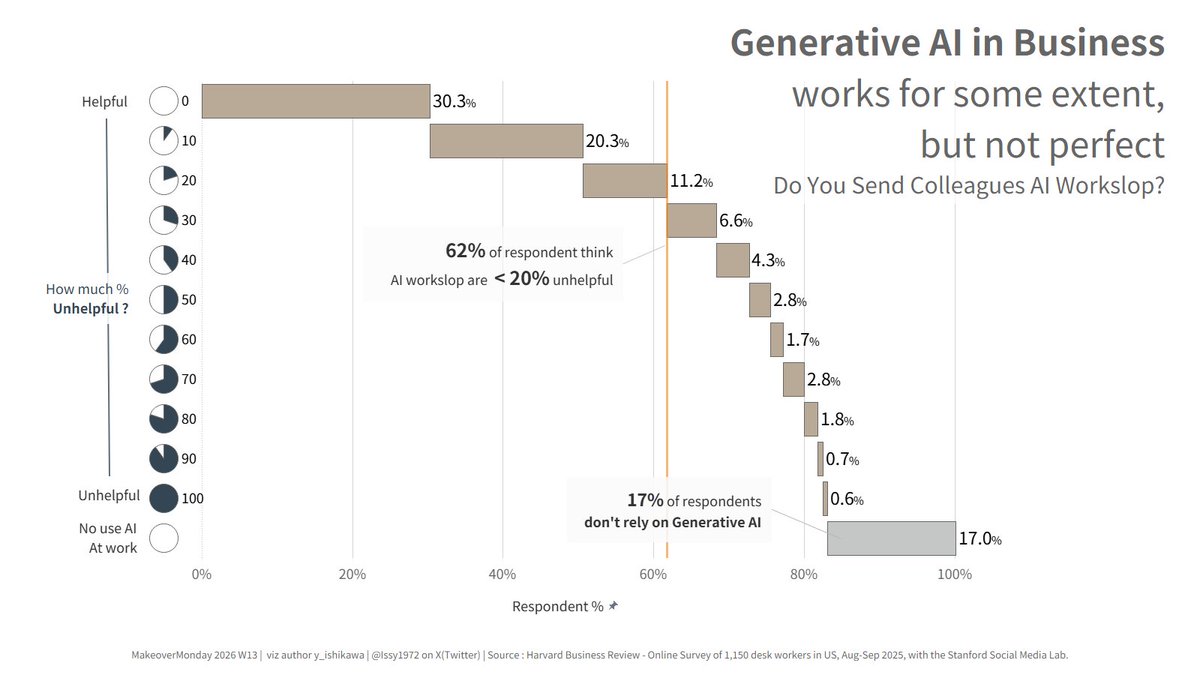
My quick #Makeovermonday Challenge W13 : AI Workslop
My choice is a waterfall chart, and putting 2 speaking points as annotation
@tableaupublic URL
https://t.co/Mw51I2Umcq