Bitcoin has printed a monthly candle that has led to further downside 28 out of 28 times since 2017.
Since Binance BTC data started, every time Bitcoin closed a red monthly candle with a 20%+ high to low range, price traded much lower again within the next 6 months.
The average drawdown from the data was -33.0% with the median around -29.7%.
Now the June close has triggered this pattern again.
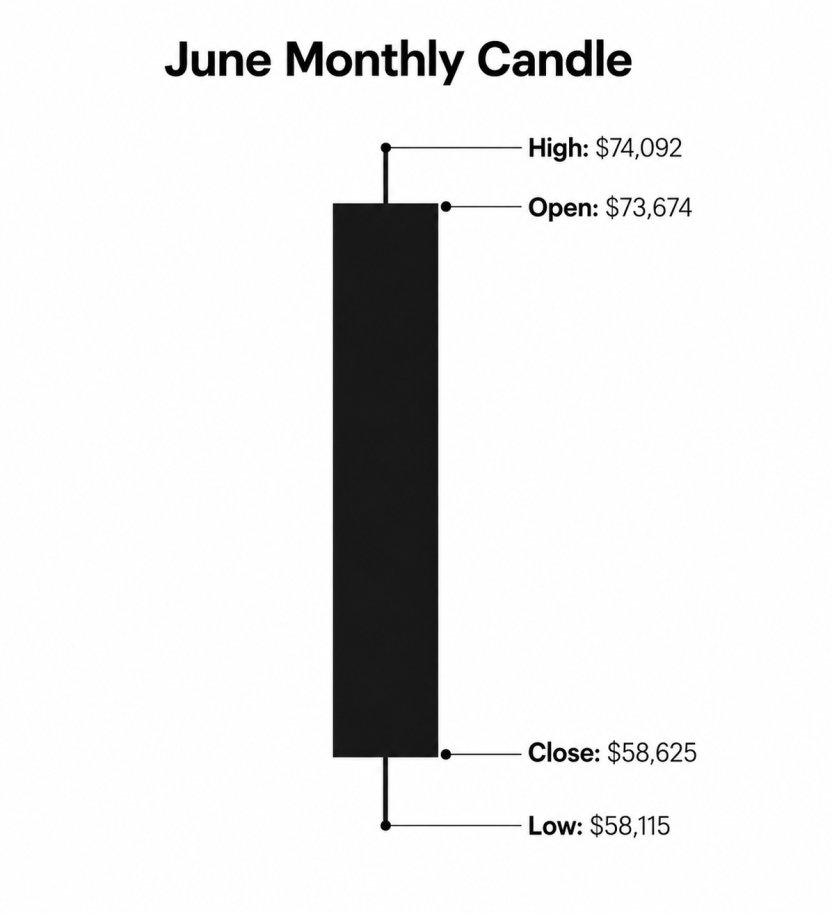
BTC opened at $73,674, wicked to $74,092, dumped to $58,115, and closed at $58,625.
That means Bitcoin closed the month down -20.4% and finished in the lowest 3.2% of the entire monthly candle.
Now this is the kind of monthly close that historically tells you the sellers are not finished and if we get to see even the median version of this setup, Bitcoin will be trading near $41K soon.
If it follows the average version, price will be near $39K.
You can call it fearmongering but the probability of this happening by a random chance is roughly 1 in 134 million.
This is not a bullish signal and quite the opposite actually.
Since spot BTC ETFs launched, whenever they bled at least $1.3B, then printed the first green day after that outflow streak, Bitcoin traded at least 5% lower within the next 30 days.
10 out of 10 times.
Average drawdown: -16.6%
Median drawdown: -11.5%
The same setup triggered again on July 2 when Bitcoin ETFs had just bled around $2.71B, then finally printed a +$223.5M inflow day and BTC closed July 2 around $61,560.
If the pattern does the bare minimum, Bitcoin will be trading below $58K before August. And if it does the average version, the move is much uglier.
So, the first green ETF day after a billion dollar bleed is usually not the start of a new uptrend and is usually the relief bid before the next leg lower.
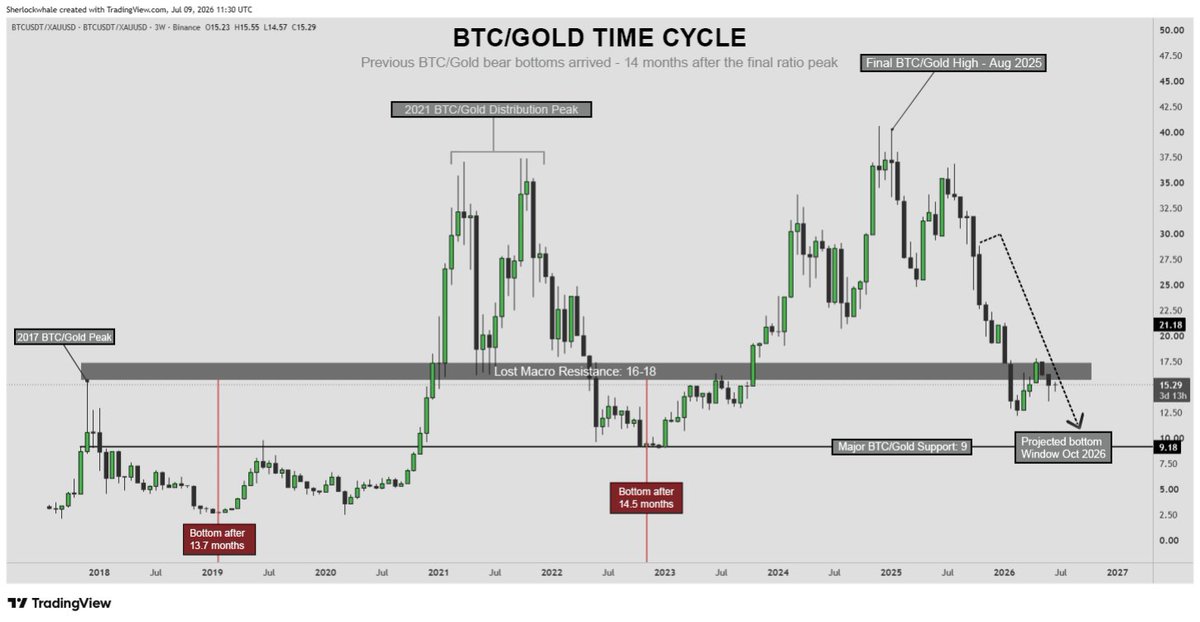
Bitcoin bottom is not be due until October 2026.
In the last two major bear markets, BTC/Gold bottoms came almost exactly 14 months after the ratio topped.
2017 top to 2019 bottom - 13.7 Months
2021 top to 2023 bottom - 14.5 Months
This cycle, the final major BTC/Gold high came in August 2025. We are only around 10.8 months from that high.
If the same timing plays out again, the real bottom window is not now. It is October 2026, right before the US midterms.
This also gives BTC/Gold enough time to bleed toward the major 9 region, which has been one of the most important levels on that chart historically.
So yes, Bitcoin can bounce here. It can trap shorts and squeeze late bears but if BTC/Gold is following the same pattern as the last two cycles, we are still around 3 months early.
So, do not get baited by small green candles.
At $139.26, $SPCX is still 3.2% above the offer price, so it has not actually undercut its IPO price yet.
But I still don't think it's cheap at $139.
For my research, I looked at 31 major tech listings, including Amazon, Nvidia, Google, Tesla, Meta, Alibaba, Uber and Airbnb. Three of them, Spotify, Palantir and Coinbase were direct listing (not a normal IPO), so the final sample was 28 companies.
Out of those 28 IPOs:
17 traded below their offer price within one year.
20 fell at least 20% below their first public close within one year.
16 fell at least 30% below their first close.
13 fell at least 40% below their first close.
Only eight of the 28 held above the initial closing price during their first year: Nvidia, Google, ServiceNow, Shopify, Zoom, Cloudflare, Unity and Airbnb.
Now compare that with the actual IPO price and these eight companies have never traded below it: Nvidia, Google, ServiceNow, Shopify, Twilio, Zoom, Datadog and Airbnb.
Now for the actual $SPCX price levels.
The median first year low among the 28 traditional IPOs was 37.76% below the first close:
$160.95 × (1 - 0.3776) = $100.17
The full 31 company sample and the closest mega platform group both will give you almost the same level, around $100.90.
There is also a second way to calculate it. The median first year peak to trough decline was 56.75%:
$225.64 × (1 - 0.5675) = $97.59
So, two completely separate measurements converge around $98-$101 and that is why I think $100 should be your first serious bid.
If I only use the IPOs launched since 2017, the typical company traded 43.4% below its first close during year one. Applying the same decline to $SPCX gives a price of roughly $91.
And among the most heavily hyped listings, the typical decline was around 54.3%, which would put $SPCX near $74. Using its listing high instead gives similar levels around $86 and $79.
That is why I see $75-$100 as the most reasonable accumulation zone.
The valuation story is also another reason to wait.
At $139.26, SpaceX is worth roughly $1.82 trillion, or 97.5 times its 2025 revenue. Even at $100, it would still carry a $1.31 trillion valuation and trade at around 70 times revenue.
So, SpaceX could become one of the greatest company ever built, but even a great company can be a bad investment at the wrong price.
My Bitcoin target is still $38K, but I’m not going to keep defending it blindly.
I have spent months explaining why I believe this cycle ends much lower, but I am definitely not emotionally attached to $38K.
These are the three things that would make me abandon the bearish thesis:
1- Bitcoin reclaims $74K and holds it on the weekly.
2- Stablecoin dominance loses 13.3% and fails to reclaim it.
3- BTC/Gold flips the 16-18 region back into support.
If all three happen, I will stop waiting for another lower low and start buying the next pullback. Until then, I still consider every Bitcoin pump a bear market rally.
Screenshot this. If Bitcoin invalidates my thesis, I will quote it myself. Until then, see you at $38K.
Ethereum’s pump is not bullish. It has been a trap 10 out of 11 times.
June candle closed down 21.7% and Ethereum then bounced more than 5% during the first 15 days of July.
I checked every time the same thing happened since 2017.
In 10 out of 11 cases, ETH later traded at least 12.5% below the price where the signal triggered, usually within just three weeks.
The average drop was 19.3%. The median was 17.2%.
This time the signal triggered on July 2 at $1,700, which puts the first historical target around $1,488. A median repeat of the setup would take Ethereum close to $1,408 before the monthly close.
So while everyone is suddenly shilling Ethereum again, historically speaking the setup is not very bullish.
This might not be the start of an ETH season but actually the final exit pump before Ethereum goes back under $1,500.
If you think Bitcoin is going to cruise past $83,000 to $88,000 with no reaction you are fooling yourself.
This zone has more sell pressure stacked against it than any level on the chart right now.
Draw the Fibonacci retracement from the $97K high to the $60K low, the complete impulsive wave down. Look where the key levels fall:
0.618 Fib: $83,435
0.65 Fib: $84,647
0.786 Fib: $89,797
And this zone is one of the biggest untested resistances on the weekly chart. Untested flips like this are where the heaviest sell pressure sits because every buyer from that level is underwater and waiting to get out at breakeven.
The average cost basis of all US spot Bitcoin ETF holders is $87,830. Every single ETF buyer from the last two years is underwater right now. When price touches $87K-$88K those investors will see breakeven for the first time in months and they will sell because they have been in pain since October.
The short term holder cost basis sits at $80,100. Every time Bitcoin pushed above the cost basis of short term holders, it formed a local top because those holders used the rally to exit at breakeven. It already happened twice and broke down. This is the third attempt with the same setup.
So, do yourself a favour and do not buy Bitcoin at $85K just to watch it drop to $40K in few months. If this cycle plays out like every other one, October will give you prices you will not believe you passed on.
Do you know that Bitcoin's entire week is decided by a single price level?
This is the Monday High Rule.
I tested what happens when Bitcoin fails to break Monday's high for the rest of the week using 452 weeks of data (8.5 years).
Monday's high not broken by Tuesday - 60% Red
Monday's high not broken by Wednesday - 74% Red
Monday's high not broken by Thursday - 79% Red
Monday's high not broken by Friday - 87% Red
The probability of this being random is less than 1 in 100 billion billion.
And the pattern is not fading, it is getting stronger. In the last 12 months, the numbers jump to 70%, 82%, 90%, and 95% by Friday. In the last 6 months, if Monday's high was not broken by Friday, the week closed red 100% of the time.
The inverse works too. If Bitcoin breaks above Monday's high at any point during the week, the week closes green 72% of the time.
Here is how to use this every week. When Monday closes, mark the high. That is your reference for the rest of the week. If Tuesday cannot break it, start getting cautious. If Wednesday cannot break it, the week is 74% likely to close red. If Thursday still has not broken it, you are looking at almost 80% odds of a red week and at that point you should not be adding longs.
This week Monday's high was $76,558. Price broke above it yesterday which flipped the projection to green with 72% odds. As long as $76,558 holds as support from here, the week closes green. If we lose it back as resistance before Sunday, we fall into the 80%+ red category.
Every time Bitcoin has broken out of a 4+ week consolidation with a weekly gain greater than 5%, the following week closed green 75% of the time across 27 occurrences since 2017 with an average gain of +5.43% and the 4 week forward return averaged +15.73%.
Now here is where it gets interesting because there is a second signal firing at the exact same time.
Last week closed green, then Sunday dumped 3.15%, then this week reclaimed everything and is about to add 8.37% on top. That exact sequence of green week into red Sunday into massive reclaim week has only happened 5 times in Bitcoin's entire history and 5 out of 5 times the following week was green with an average return of +7.09%. One of those 4 was a +25% week.
We now have two independent bullish signals both firing on the same weekly close with a combined historical accuracy of 75-99% and average follow through of +5% to +7% in the next week alone.
If this plays out like the previous 27 consolidation breakouts, Bitcoin is at $80,000 by next Friday. If it plays out like the previous 5 red Sunday reclaims, it could push toward $82,000-$84,000.
Bitcoin's complete playbook for next week. I have tested every level against 450 weeks of data.
This week is closing around $76,000 which is a 7.2% gain from Monday's open. But the high was $78,333 on Friday and Saturday gave most of it back with a 1.79% dump and Sunday only recovered half of that.
The weekly candle is closing at 70% of its range which means price is not closing near the highs where you want to see strength, it is closing in the upper half but with a clear rejection wick above.
That matters for next week because a weekly close at 70% of range after breaking a prior week's high has historically been followed by a red week 62% of the time. Not a guaranteed sell but worth knowing before you go all in on Monday.
Here is what the data says about next week based on where Monday and Wednesday close.
If Monday closes above $79,800 which is 5% above the open, the week has closed green 89.6% of the time historically and since 2021 that number is 95.5%.
If Monday closes above $79,116 which is 1% above this week's high of $78,333, that confirms price is not just wicking above resistance but actually holding above it and historically that means the breakout is real.
If by Wednesday the week is still up more than 3% from Monday's open, the week closes green 86% of the time across 141 occurrences and if it is up more than 5% by Wednesday that jumps to 91.4% across 93 occurrences.
On the bearish side, if Monday closes below $74,480 which is 2% below the open, that confirms the Friday pump was a trap and the Saturday rejection was the real move.
If by Wednesday the week is down more than 2%, the week closes red 80% of the time and in the last 3 months specifically that number has been 100%, 5 out of 5 with zero exceptions.
And if Monday somehow closes below $69,861 which is 1% below this week's low of $70,567, that is a full sweep of the weekly range and historically the rest of the week bounces green 81.8% of the time. That is the level where you buy, not sell.
$79,800. $79,116. $74,480. $69,861. These four numbers are your entire week. Bookmark and check them Monday and Wednesday.
There is an algorithm selling Bitcoin every Tuesday at 5AM UTC. It has not missed a single week in 6 months.
Here is everything I know about it.
At 3AM the first signs of selling appear and if you are not watching the hourly chart you would miss it completely since most of it is invisible on the daily chart. By 5AM there is a dramatic increase in this sell off. Surprisingly, the volume at 5AM on Tuesdays is 36% higher than the same hour on any other day of the week which means whoever is behind this is not passively offloading a few coins, they are executing a deliberate sell with real size at the same hour every single week
This 5AM candle has been red for 12 consecutive weeks and what makes this interesting is that before the $126K top in October 2025, this hour had zero edge in either direction, it was pure noise. Then Bitcoin topped out and something activated at this exact hour every Tuesday like a switch was flipped, and it has not produced a single green candle in 3 months, the probability of 12 reds in a row by chance is 1 in 5,000.
But here is the part that convinced me this cannot be human selling. The percentage drop is nearly identical every single week and it does not matter what price Bitcoin is trading at, whether it was $120K back in October or $65K last week the average drop is 0.38%, the same size every time like someone copy pasted the same order 12 weeks in a row. Humans do not sell in perfectly consistent percentages across a 50% price range, algorithms do.
After the 5AM candle closes, price does something very specific that you need to understand because it is designed to make you enter the wrong trade. It bounces. Not a lot, 0.02% to 0.09% between 6 and 7AM, but enough to make it look like the selling is exhausted and the buyers have stepped in. But from 7AM all the way through London and into the 1:30 PM UTC US open the selling continues quietly and by the time the American session is in full swing, 80% of the time the price is lower than where it was at 5AM.
And the damage does not stay contained to one hour. Tuesday erases Monday's gains 70% of the time since October. When Monday closes green, Tuesday closes red 70% of the time.
In fact, Tuesday has held the weekly high only 11% of the time in the last 6 months. Monday holds the weekly high 42% of the time. Monday builds it, Tuesday destroys it, every single week.
I do not know who is behind this. I do not know if it is an ETF rebalancing, a market maker hedging, or something else entirely. But I know it starts at 3AM, peaks at 5AM, fakes a bounce at 6AM, and bleeds until New York opens. And I know it has not missed a single Tuesday in 3 months. Whoever it is, they will be running it again next Tuesday at 5AM UTC.
My favourite weekly strategy on Bitcoin has a 93% win rate since 2017. 16 triggers with only 1 failure.
Here is the full system.
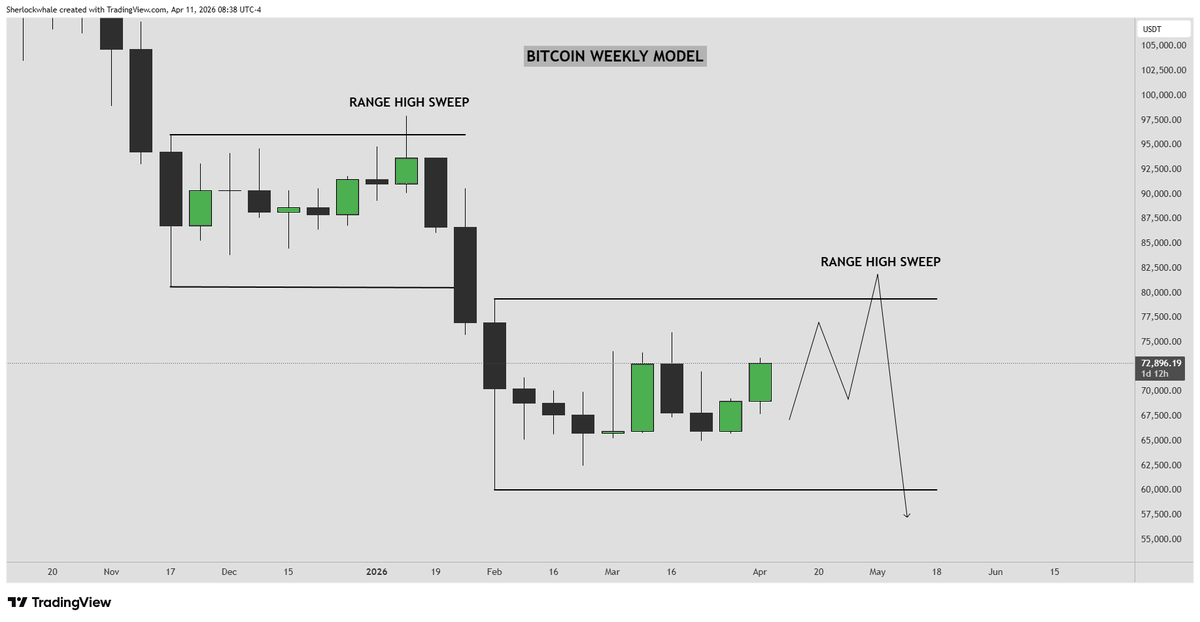
It starts with identifying the weekly range. You need four consecutive weekly candles to close inside the range of a single previous weekly candle. Four weeks of price being compressed inside one candle's high and low. When that happens, the market looks dead but it is the opposite. Four weeks of compression means smart money is loading positions while retail thinks nothing is happening, and the breakout reveals which side they loaded.
Once the range is established, you wait for one of four triggers.
Trigger 1, sweep of the range high and close back inside the range. Price breaks above the high, grabs the liquidity sitting above it, and closes the week back inside. That is a short signal. The breakout was fake, the stops above got taken, and now price reverses.
Trigger 2, weekly close above the range high. Price does not just wick above, it closes above. That is a long signal. The breakout is real and you ride it.
Trigger 3, sweep of the range low and close back inside the range. Price breaks below the low, grabs the liquidity sitting underneath, and closes back inside. That is a long signal. The breakdown was fake, the stops below got taken, and now price reverses.
Trigger 4, weekly close below the range low. Price does not just wick below, it closes below. That is a short signal. The breakdown is real.
The logic behind all four triggers is the same. When price has been compressed inside a range for four weeks, the first move out of that range either traps people or confirms direction. A sweep that closes back inside means the breakout was a liquidity grab. A close outside means the move is real.
This is the cleanest weekly strategy I have ever used and only requires checking the chart once a week on Sunday night.
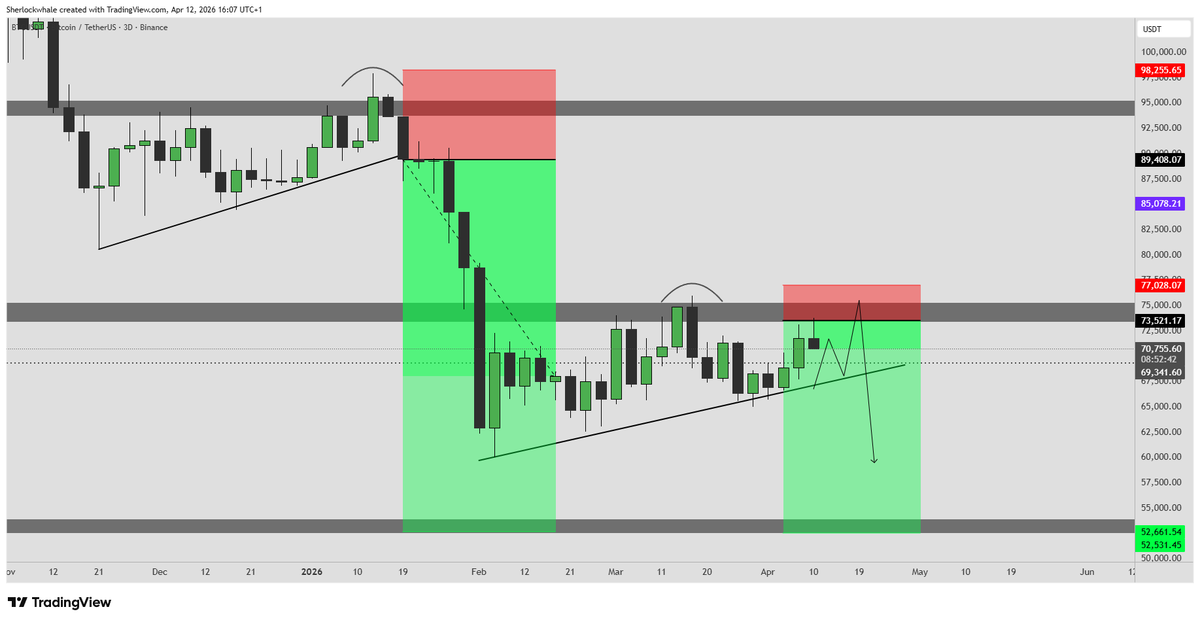
For anyone who took this short, move your stop to entry. The position should be risk free now.
First TP should be the trendline retest around $67K. Take partials there and let the rest run toward the $53K target.
$53K too much to ask for?
Bitcoin was up 5.8% by Saturday but then Sunday erased more than half of the gains in a single day.
I backtested every time Bitcoin had a green week where Sunday's single day drop erased more than half of the gains that were built over the previous 6 days.
There have been 20 such occurrences since 2017 and the following week closed green 70% of the time with an average return of +2.64%.
But here is where it gets interesting. The more Sunday destroys, the more bullish the next week becomes.
1- When Sunday erases 100% of the weekly gains, the next week is green 70% of the time.
2- When Sunday erases 2x of the weekly gains, the next week is green 75% of the time with an average return of +6.46%.
3- When Sunday erases 3x or more, the next week is green 83% of the time with an average return of +7.22%.
The logic is simple. Sunday is the lowest liquidity day of the week. A massive dump on Sunday does not represent institutional selling. It represents a liquidity vacuum where a small amount of selling moves price disproportionately far. Then Monday arrives, real volume shows up, and the smart money buys what the Sunday panic sellers gave away.
In the last 12 months, this pattern has triggered 3 times. All 3 times the next week was green.
This week, Bitcoin rallied from $69,034 to $73,043 by Saturday, a 5.8% move built over 6 days. Then Sunday dumped it back to $70,800 in a single day, erasing more than half the week's progress. That puts us in the exact setup right now.
The people selling into Sunday's dump are doing exactly what this pattern needs them to do. They are providing the liquidity for next week's move.
Bookmark this and use this logic to buy whenever you see a big red candle on Sunday.
I backtested every week since 2017 where Bitcoin was up more than 3% by Wednesday close and across 141 occurrences, the week closed green 86% of the time.
Above 5% by Wednesday and the number jumps to 91% across 92 weeks.
Right now the weekly open is $70,741 and Tuesday closed at $74,131. Here are the two important levels that will decide the weekly close.
1- If Wednesday closes above $72,863 (3% above the weekly open), the 86% pattern fires. 121 out of 141 weeks closed green from here.
2- If Wednesday closes above $74,278 (5% above the weekly open), the 91% pattern fires. 84 out of 92 weeks closed green from here.
But whenever the week was up more than 5% by Wednesday and still closed red, the average drop from Wednesday to Sunday was around 8.2%. Those are the 9 out of 92 exceptions. So when this pattern fails, it fails hard but yes, it only fails 9% of the time.
$72,863 and $74,278, make sure to check these two numbers at midnight UTC tonight.
Also, if you have been following the series then you already know the weekly close is decided by Wednesday and the Monday close sets the direction for the rest of the week.
@tiprolin_ I actually tested upto 1% but didn’t mention in the tweet. Here are the results.
0.25% : 100% green
0.50% : 94.3% green
0.75% : 90.7% green
1.00% : 89.0% green