Beyond the statistics, another trend emerged in 2024: an abundance of inventory. With over 26,000 active listings in September—levels unseen since 2010—supply is poised to grow even further in 2025. As the "renewal storm" of expiring mortgages intensifies through 2025 and into 2026, and with many unsold homes from last year set to return to the market, we could easily see total active listings surpass the 30,000 threshold.
#RealEstate #Ontario
One of the biggest misconceptions is that rate cuts automatically lead to rising home prices. This cycle has shown that supply, absorption, and affordability matter just as much. Markets move in phases, not headlines.
Ontario Real Estate - A Macro View.
January 2020 marked the starting point of one of the most aggressive price expansions in Ontario real estate history. By March 2020, with interest rates pushed to historic lows in response to global economic shocks, capital flowed freely into housing. The result was a rapid repricing of assets, driving the Toronto Regional Real Estate Board MLS Home Price Index benchmark from $799,400 to $1,279,800 by February 2022, a 60.1% increase in just over two years.
February 2022 proved to be the inflection point. As inflation surged, interest rates were raised aggressively, shifting affordability dynamics almost overnight. What followed was not a single sharp correction, but a prolonged repricing cycle. From the market peak to December 2025, benchmark values declined 26.4%, settling at $942,300.
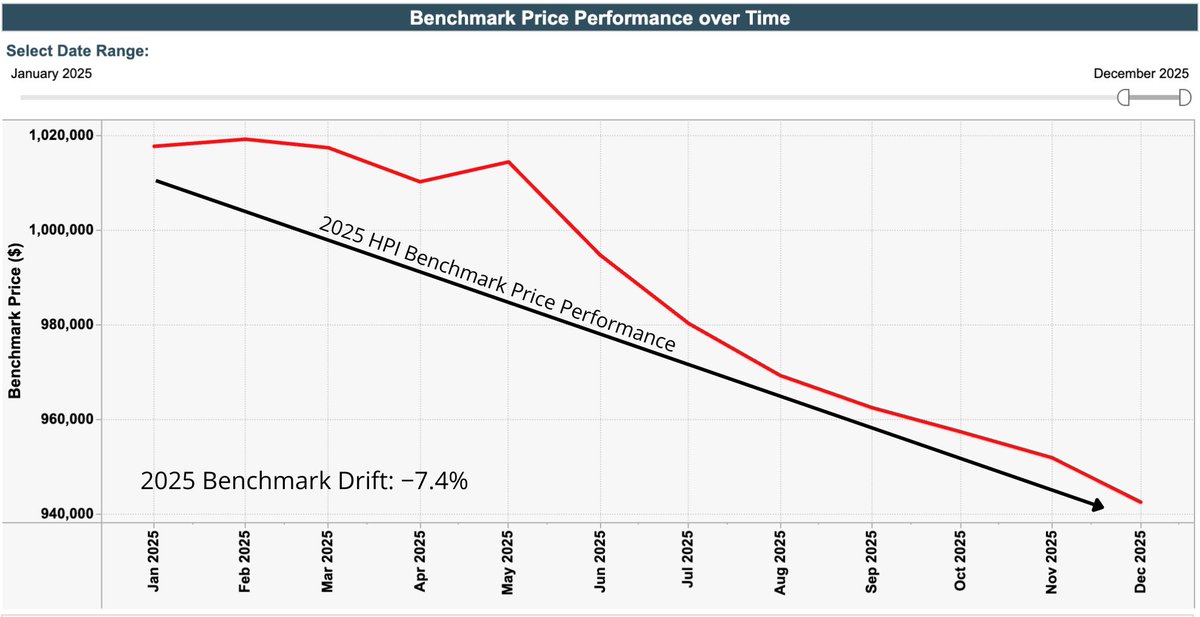
By 2025, the market’s character had fully changed. Sales volumes remained historically low, while inventory quietly accumulated. Active listings reached 31,603 in June 2025, the highest level in more than 20 years. Average days on market climbed to 56, and pricing trended consistently downward throughout the year. From January 2025 to December 2025, benchmark prices declined a further 7.4%, underscoring the absence of a meaningful rebound.
Looking ahead, the data suggests continuity rather than reversal. 2026 is likely to resemble 2025, with similar supply-demand imbalances, longer selling timelines, and pricing pressure, conditions that may extend well into 2027. In this phase of the cycle, outcomes are increasingly driven by strategy, pricing discipline, and execution, not momentum.
Data shown reflects Toronto Regional Real Estate BoardMLS Home Price Index (HPI) Benchmark Price Performance for the Composite.
The Composite benchmark represents an aggregate of all residential property types, including detached, semi-detached, townhomes, and condominium apartments.
Figures reflect market conditions across the Greater Toronto Area, including Toronto, Durham, York, Peel, and Halton Regions.
Provided for informational purposes only and does not constitute financial or investment advice. Individual property values and outcomes may vary.
AI-Jake Saga: Episode 2
Laser grid buzzing. Briefcase locked in.
Then the buyer’s agent calls with the lowest offer of the year…😂
AI-Jake: “Did you forget to add a zero?”
Real estate in 2025 is basically a spy thriller.
Mission Closed 💼 | AI-Jake Saga Ep. 1
A client call. A moving train. A flawless close…WAY under asking. 🚄📱
🤖AI-Jake handles negotiations like no other. 😂😂
#realestate#ai#action#comedy
👑Strategy vs. a $35k Loss📉
💭 Sell now or hold for spring? A timely dilemma for sellers eyeing a downsize.
In this video, I dive into a recent client consult: weighing an immediate move against waiting for the seasonal uptick. We crunched the rolling three-month average prices—his current home dipping ~3%, while target downsizes stay flat.
📉That gap? It risks 3-4% equity erosion, potentially costing tens of thousands ($35k).
🎯Context matters, though. I map out the data, risks, and options to guide informed choices.
@ShaziGoalie
@band_milli@ZssBecker@gregisenberg Thats great! It’s valid for you—not for most. Most boomers and gen X don’t even want to use ai let alone trust it with legal documentation. 50/50 millennials might and majority of gen z likely.