Das muss man sich vorstellen! Um zu veranschaulichen was Windradabstände konkret bedeuten würden,überträgt ein Journalist in einer Karte die strengen Abstandsregeln für Windkraftanlagen von Bayern auf ganz 🇩🇪 und wird vom bayerische Amt für Digitalisierung (LDBV) dafür angezeigt.
Also fascinating how, at the same time, you can get very close to built reality using broad generalisations.
> floor height assumed to be generally 3.5 m
> building height ai-generated from aerial imagery and generalised to 10m squares...
#30DayMapChallenge
Late Day 26: Islands
Although blocks in a city can be very different, they may end up creating a more or less homogenous image if measured by a sole indicator. There might be a bigger lesson hidden close by...
#urbanform#stretchingthetheme
#30DayMapChallenge
Day 12/ 21: Scale/ Kontur data
A scale comparison of every inner-german IBA since 1989. Compared to older ones, they mostly turned into an instrument of regional transformation. Still fascinating how different they really are.
#IBA
#30DayMapChallenge
Day 4/ 11/ 18: Colours Red, Green, Blue
Election results from the federal elections in Germany in 2021, weighted.
I find these quite worrying, because most of these parties aren't serious about climate change - and the blue ones are right-wing extremists...
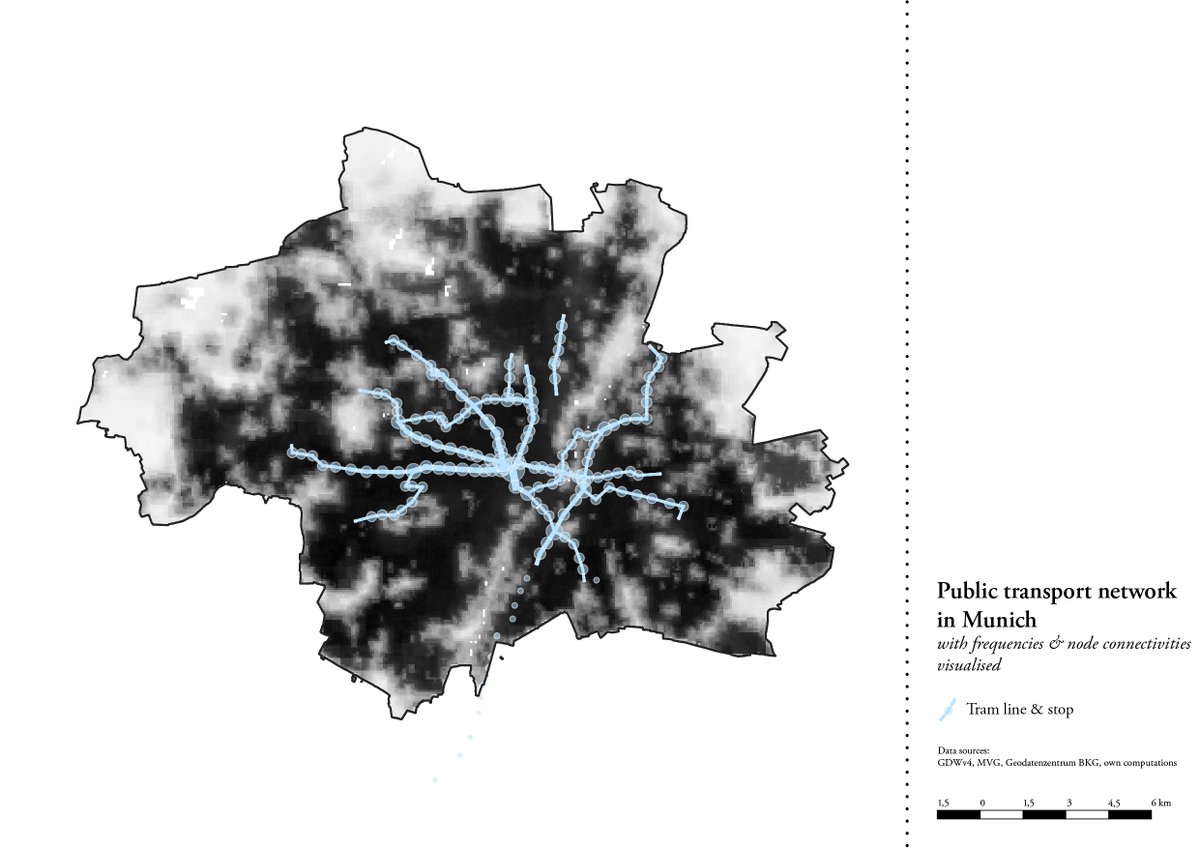
Also sorry for the heavy use of hex grids - I do love them. Accidentally, I also found an easy way to show just how centralised the public transport in Munich is.
#30DayMapChallenge
Late Day 8: OSM data
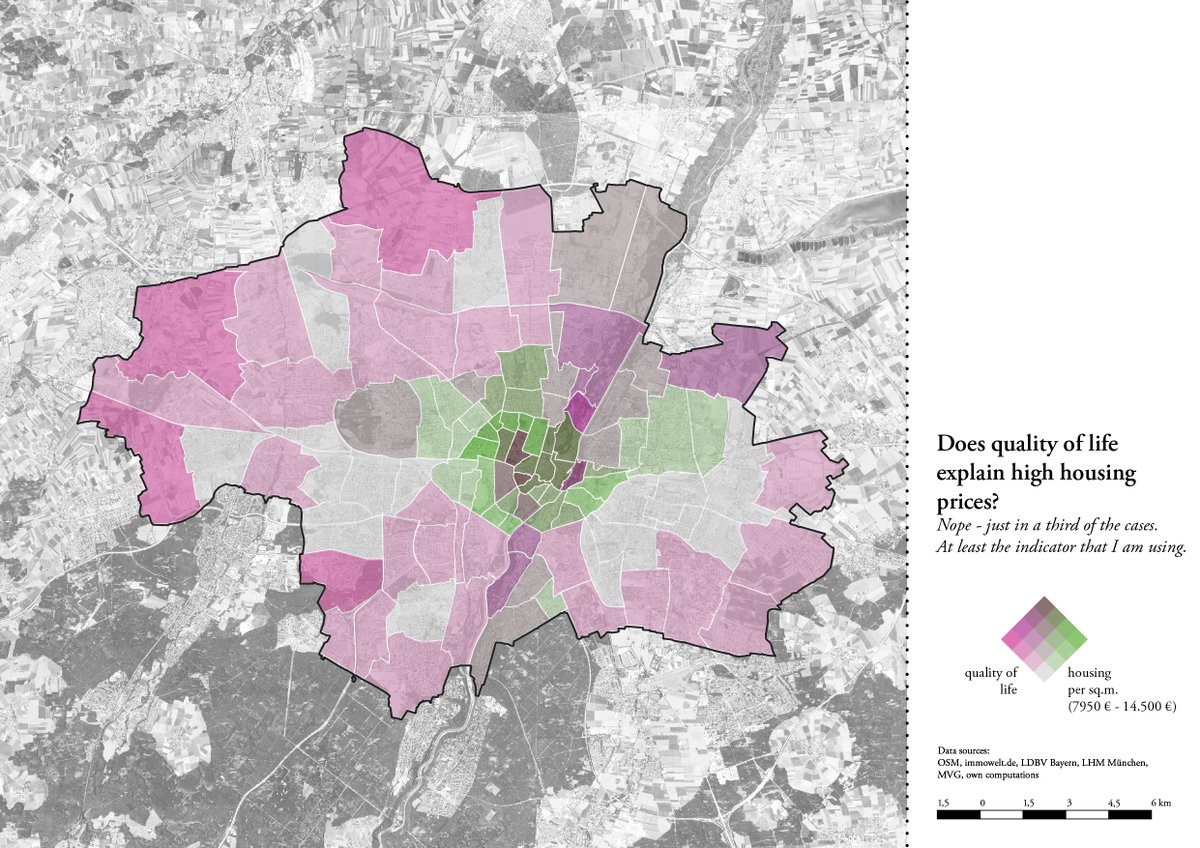
I got a bit carried away - what you see here is a rough quality of life indicator built from OSM data. I then checked whether that coincides with high housing prices. Should have balanced it out more, I guess.
#citiesforpeople
The data here is a bit sketchy - as in from different points in time - but the general message should hold up. Of course, I should be happy that most development is happening within settlements (but then there's other problems with how that's done here...)
#30DayMapChallenge
Day 9 - #space
Even though Bavaria does have a "space saving initiative" (which is a toothless tiger), it keeps missing its goal of keeping greenfield development to 5 ha/ day. It's been roughly double for the past years.
#landuse#regionalfood
#30DayMapChallenge
Late day 7: Raster
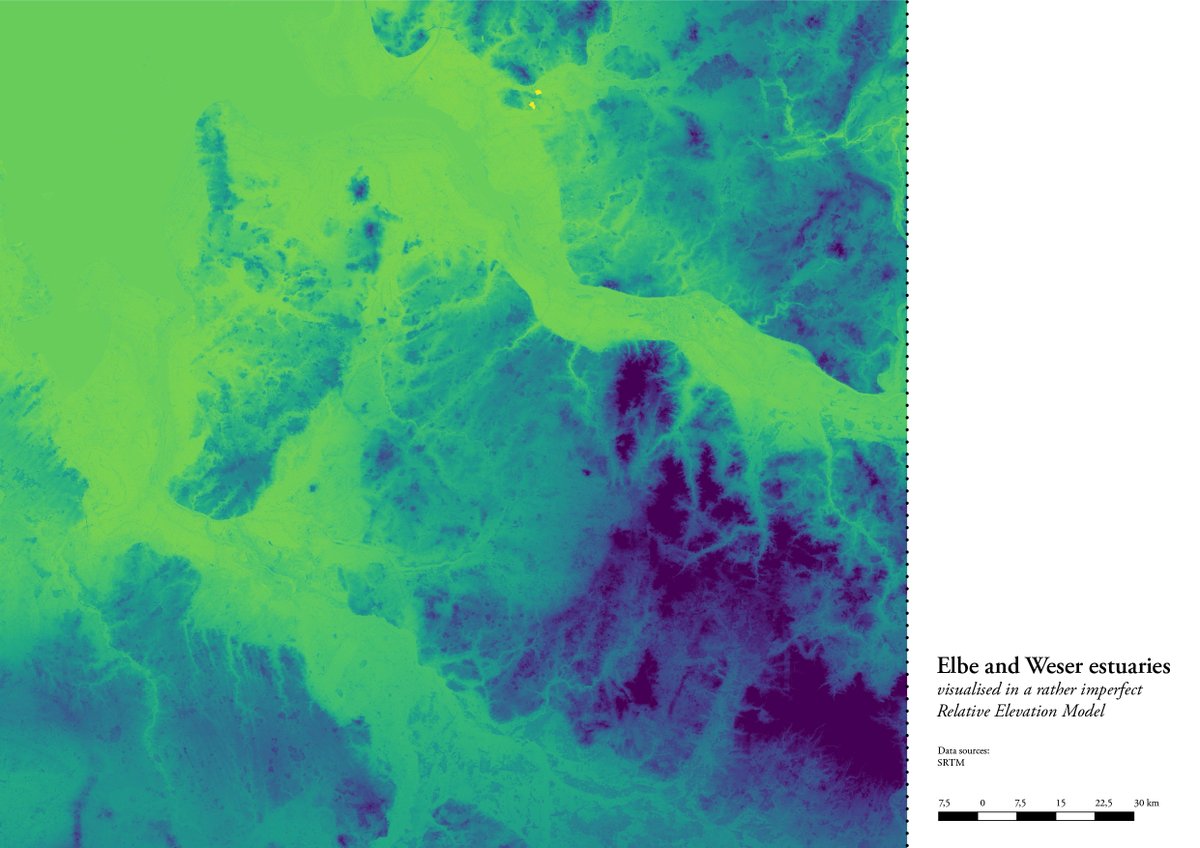
A (somewhat unfinished) REM of the Weser and Elbe estuaries in Northern Germany. Just because I think it's fascinating and beautiful.
#turningthetide
Thanks for the tutorial to @geo_coe
Traffic infrastructure and intensive agriculture keep eating away at it. This is made no easier by the fact that this line connects 5 East German and 4 West German Länder, meaning differing governance regimes across its length.
#30DayMapChallenge
Belated day 4: Green
The former East German border was an opportunity for nature: due to practically nobody being allowed to enter or cross this strip across the country (except for certain points), it became a refuge for rare species by accident.
#rewilding
I've mapped all protected nature areas directly connected to the border, the strip is itself is rather thin for most parts. While it has been put under increasingly severe protection regulations for large parts, it is still consistently under threat:
Courtyards is appropriate only for some types of urban fabric, but so is my approach here :) I think the "yellow one" works almost well enough for traditional blocks. If anyone knows a better approach (for a German context), let me know.
Day 2 of the #30DayMapChallenge - LINES that represent the fluxes of one of the Milan Food Waste Hubs developed by the @FoodPolicyMi together with a wide range of local actors redistributing food surplus from retailers for people in need