@T_Harv_Eker Yesterday, our family had a successful start to the school year. It is going to be a great year! Reminded me of this girl’s affirmations: https://t.co/1MivS3fzly
Our partners at AWS just combined our powerful #GraphDatabase Browser app with #AmazonNeptune and Amazon Comprehend Medical to visualize a massive corpus of #coronavirus research publications. Check it out: https://t.co/uZYtbbrG6v
Is this a new layout which I see before me?! Sneak Peek Alert! And our #Covid19 data visualization is growing and changing. Not only are the number of mutational events increasing, but more and more are sharing the same mutation. Here, blue hexagon nodes show shared mutations.
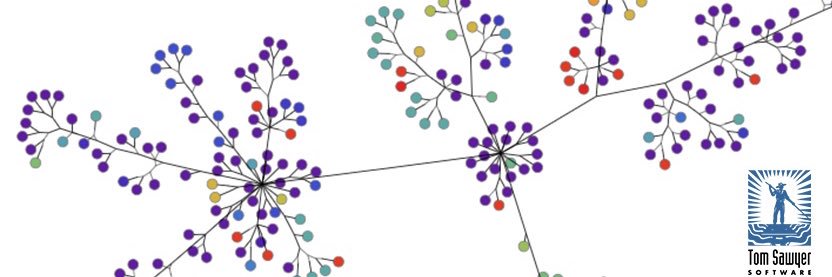
We used #TSPerspectives to create this unique #graphviz of the #Nextstrain data. #Covid19 researchers, check this out!
We show where the same mutation has occurred in different genomes. And that duplication could indicate that those mutations are particularly important.
Our latest #Nextstrain visualization reveals new insights! Here, each node represents a genome. We grouped genomes that share a mutation (blue octagon nodes). This duplication could indicate that these mutations are particularly important to understand for #Covid19 researchers.
This Corona virus-related visualization shows the activities of #Patient31 — we can see at both high and low levels where and what this person did immediately before being diagnosed with #COVID19.
Our graph of #Patient31 can be expanded to to switch between a high level or more detailed view of her activities. We used the Parent/Child Drawing feature in #TSPerspectives to visualize her movements in and out of hospitals, a popular restaurant, and in and out of church.
Sometimes you just need to see things from a different angle. Our Orthogonal layout of #Covid19 data highlights where lots of branches--and mutations happened. We're continuing to build as #nextstrain adds more data. Stay tuned! https://t.co/kEZmunEjpH
Folks find the #Covid19 data from #nextstrain hard to understand. We've got you! We combined the power of #TSPerspectives with the genomic epidemiology to produce a symmetric graph that follows the mutations of the virus around the world. More to come! https://t.co/R6oeFcpUtd
Folks find the #Covid19 data from #nextstrain hard to understand. We've got you! We combined the power of #TSPerspectives with the genomic epidemiology to produce a symmetric graph that follows the mutations of the virus around the world. More to come! https://t.co/R6oeFcpUtd
Using #TSPerspectives social network anlaysis, we can follow the spread of information on #COVID19, identify key individuals, and even examine the tone of their messages. Try a free evaluation: https://t.co/xIMA2SWVk0
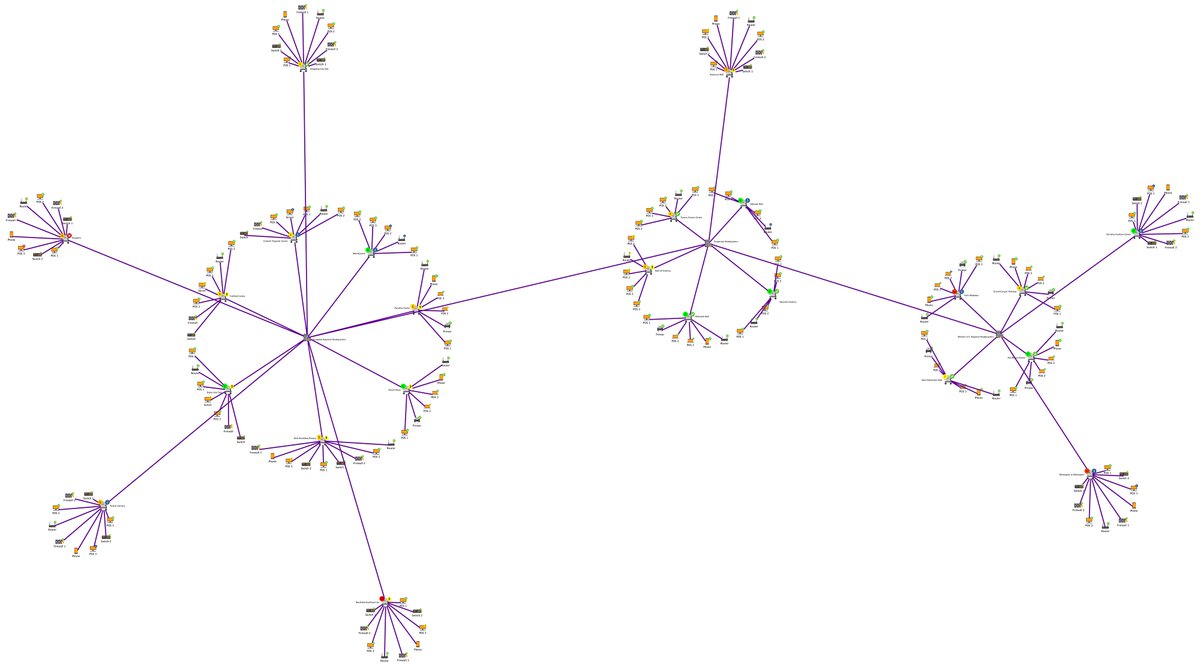
Creating #graphviz for social, communication, or network analysis? The Circular Layout should be your BFF! The natural clusters created show both the big picture & the details within each circle, allowing you to see strengths and weaknesses within the network. #TechTipTuesday