Analizando NDVI con @qgis de ensayos de Fitosanitarios en Agricultura
@deepseek_ai anda muuyy bien, los códigos y explicaciones son simples y salen andando de una, @ChatGPT_LATAM es más rápido pero más enroscado y complejo, te amaga que te va a dar todo, pero te pide plata.
Analizando NDVI con @qgis de ensayos de Fitosanitarios en Agricultura
@deepseek_ai anda muuyy bien, los códigos y explicaciones son simples y salen andando de una, @ChatGPT_LATAM es más rápido pero más enroscado y complejo, te amaga que te va a dar todo, pero te pide plata.
🌱 Satellites easily track deforestation—but restoration? That’s been harder.
Restoration groups like Wells for Zoë now use open-source geospatial data to track progress & refine strategies—helping strengthen impact.
➡️ Learn more in our impact article: https://t.co/weAobd0540
Track positions in the background, even when your device is locked, for more efficient fieldwork. Enjoy seamless WebDAV folder integration, grid decorations, improved QFieldCloud downloads, and new plugin enhancements, that allow for example OpenStr...
https://t.co/qaXoQf7ntK
CULTIVOS DE COBERTURA | SIEMBRA AL VOLEO CON DRON EN CAMPOS DEL GRS.
Es una actividad que en distintas empresas del GRS se viene llevando a cabo desde hacer varios años. Pero en esta última campaña, lo novedoso es que se está realizando con dron.
📊🚀 Si te encanta el poder visual e interactivo de Tableau, te traigo su versión en R. 😱
✨ El paquete {GWalkR} es una herramienta interactiva que convierte tus dataframes en una interfaz visual estilo Tableau con solo arrastrar y soltar. Fácil e interactivo. 🧑💻
#dataviz
Regression outputs contain many different components, each providing crucial insights into the effectiveness and characteristics of the model.
The detailed explanation below will help you understand the various parts of the regression model output provided by R. From the formula used to the statistical significance of the coefficients, each element plays a key role in interpreting the overall performance and validity of the model.
✅ Call: Restates the regression formula and the data set used. Example: Modeling happiness with predictors (gdp, social, freedom, corruption) using data set my_data.
✅ Residuals: Differences between observed values and model predictions. Summary includes:
- Min and Max: Range of residuals.
- 1Q and 3Q: Middle 50% of residuals.
- Median: Middle value of the residuals. Close to 0 suggests accuracy.
✅ Coefficients: Provides estimates of the regression coefficients and their significance:
- Estimate: Impact of each predictor on the target variable. Example: Increase in gdp leads to a 0.25374 increase in happiness.
- Std. Error: Variability of each estimate.
- t value: Test statistic for the significance of each coefficient.
- Pr(>|t|): p-value for the t-test; values < 0.05 often indicate significant effects.
✅ Significance codes: Quick reference for significance levels next to the p-values.
✅ Residual standard error: Measure of the fit quality, indicating the average size of the residuals. Lower values suggest a better fit.
✅ Multiple R-squared: Proportion of variance in the target variable explained by the predictors. For instance, 82.51% in this model.
✅ Adjusted R-squared: Adjusts the R-squared to account for the number of predictors, providing a more accurate measure of model performance.
✅ F-statistic and its p-value: Tests if at least one predictor has a non-zero coefficient. A small p-value rejects the null hypothesis that all coefficients are zero, confirming the model’s significance.
Explore my webinar titled "Data Analysis & Visualization in R," where I demonstrate how to estimate linear regression models alongside other essential techniques.
See this link for additional information: https://t.co/xZl4UCUpHG
#RStudio #DataAnalytics #programmer #RStats #datastructure
🚀 Open Earth Engine Toolbox V2 is Here! 🎉
Experience new improvements, integrated AI 🤖, and a redesigned background for better performance and fewer crashes! ⚡🚀
Check it out now: https://t.co/JhciT6Djar | https://t.co/QcrWk9Jeju
#EOchat#EarthEngine#AIEmpowered#GEE
🌳🌳 Robust Trend Analysis in #Environmental Remote Sensing: A Case Study of Cork #Oak#Forest Decline
✍️ Oliver Gutiérrez-Hernández and Luis V. García
🔗 https://t.co/afhWXkar8C
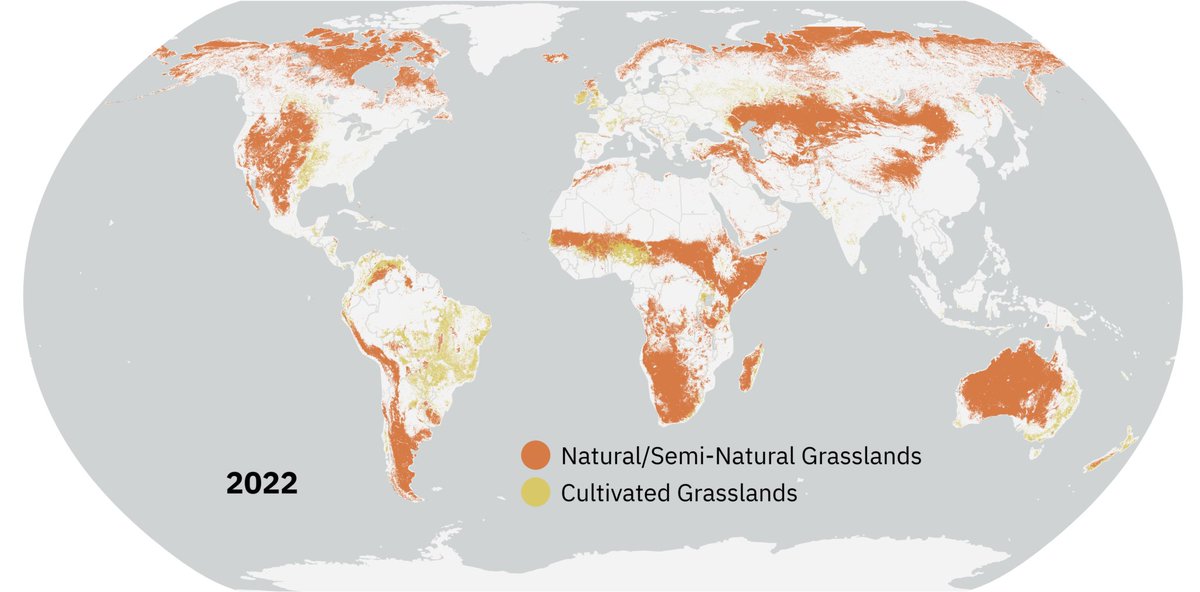
#DYK grasslands are the single largest land cover on Earth’s ice-free surface?
They store 34% of the world’s terrestrial carbon stock and provide critical habitat to large mammals. 🐘
Despite their importance, these ecosystems are often unprotected.
🍇🍇 From Space to Field: Combining #Satellite, #UAV and #Agronomic Data in an Open-Source Methodology for the Validation of #NDVI Maps in Precision #Viticulture
✍️ David Govi et al.
🔗 https://t.co/ex65j4cui1
Mapeo de Cobertura de Bosques Nativos con productos de Amplitud y Fase del Radar Argentino Banda L #SAOCOM una gran oportunidad para monitorear suelos y biomasa de bosques en los extensos bosques áridos y semiáridos de Argentina.
Publicamos nuestras pruebas para detectar cobertura de bosques nativos con el SAR Argentino orgullo nacional. @CONAE_Oficial@SecreTurAmbDep
Use of Argentine SAOCOM SAR polarimetric L-band satellites for classification of arid and semiarid native forests https://t.co/zl83pJ54BN