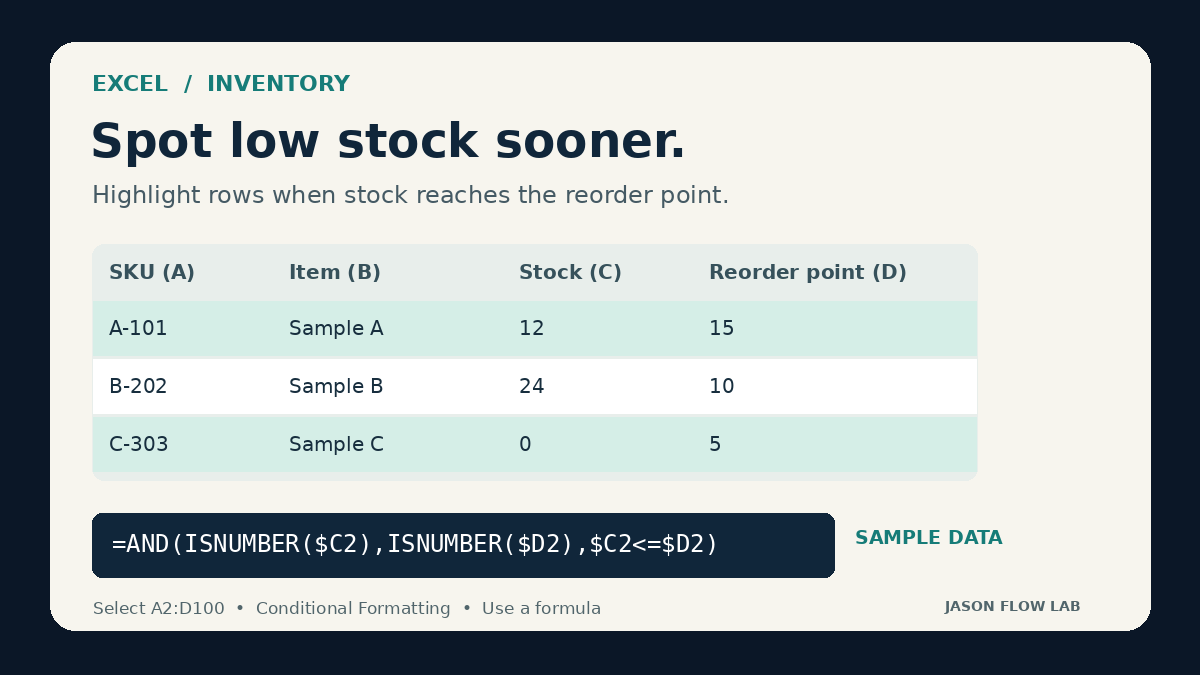
Low stock hiding in a long Excel list?
Select A2:D100 → Conditional Formatting → New Rule → Use a formula:
=AND(ISNUMBER($C2),ISNUMBER($D2),$C2<=$D2)
C = stock on hand; D = reorder point. Pick a fill and test a few rows, including zero.
Which inventory check is most manual?
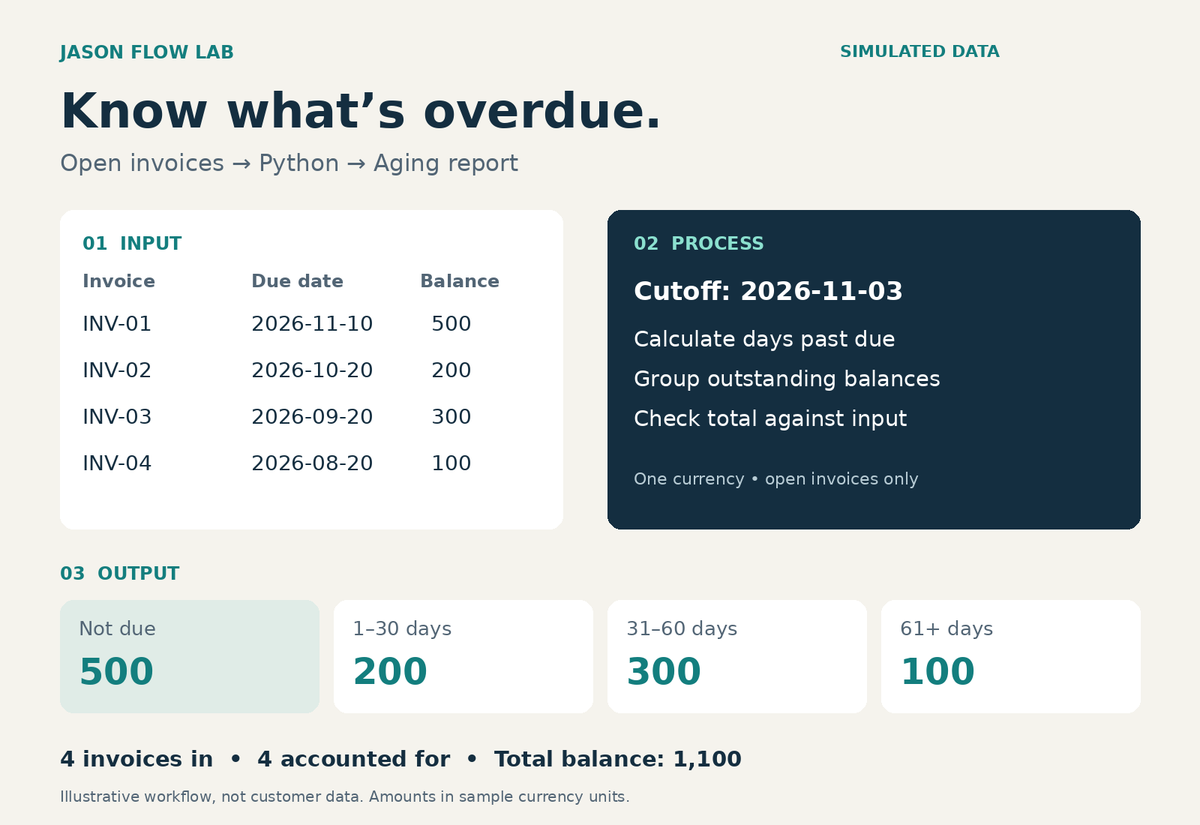
Demo with sample data:
Input: open invoices with due dates and balances.
Process: Python calculates days overdue at a fixed cutoff and groups balances by age.
Output: an aging report that ties back to the invoice list.
Still sorting overdue invoices by hand? Reply below.
Excel total too low after an import?
SUM ignores text in referenced cells.
Check a suspect amount: =ISNUMBER(A2)
FALSE? Try =VALUE(A2) in a helper column; fill down, review errors, then sum the cleaned amounts.
What export keeps breaking your totals? Reply below.
@marvin_gerstner Thanks Marvin, exactly. I've seen a shared workbook where someone inserted one column and a hard-coded VLOOKUP quietly pulled the wrong field for weeks. Structured references are the first thing I set up when I build these files now.
Inserted a column and VLOOKUP returns the wrong field?
Use a return column, not a fixed number:
=XLOOKUP(A2,Products[SKU],Products[Price])
Products = Excel table; A2 = SKU to find.
Microsoft 365 / Excel 2021+.
Test a known SKU after edits. Stuck? Reply below.
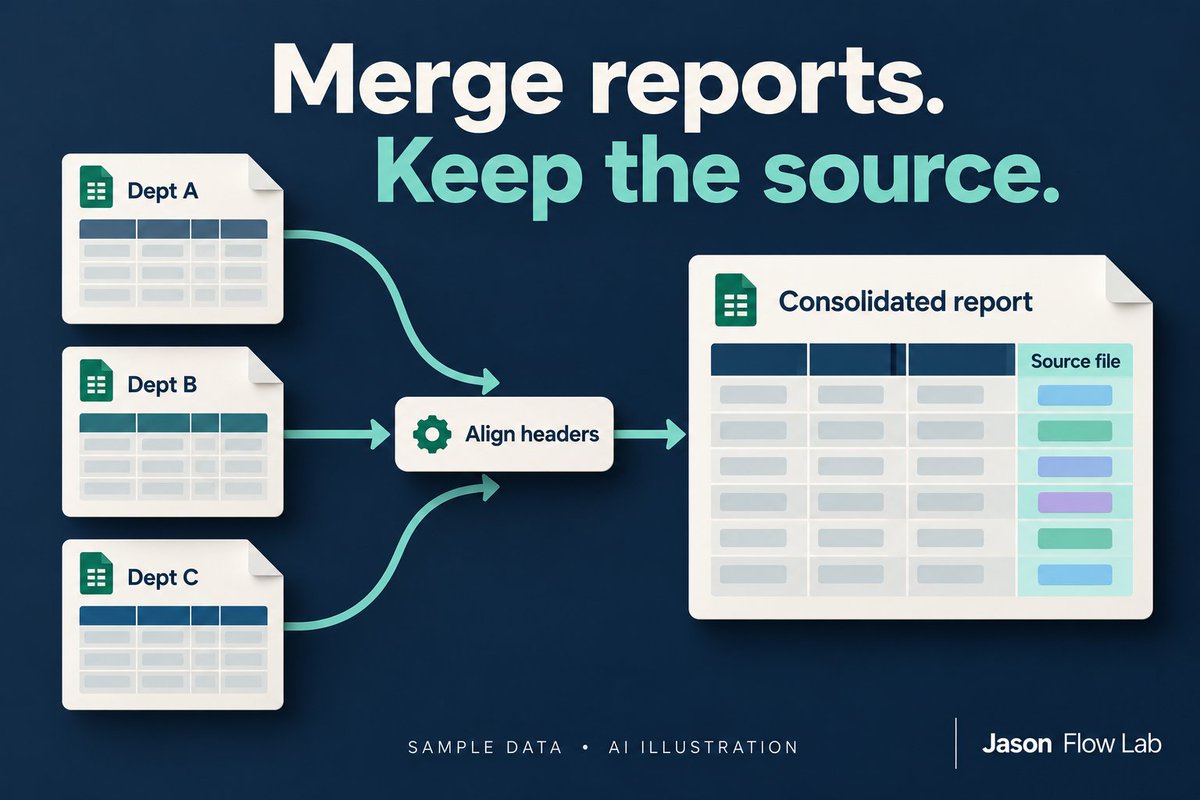
Illustrated workflow (sample data):
Input: department Excel reports.
Process: align headers, append rows, tag each row with its source file.
Output: one consolidated table with traceable rows.
Which part of your monthly merge needs the most manual work? Reply below.
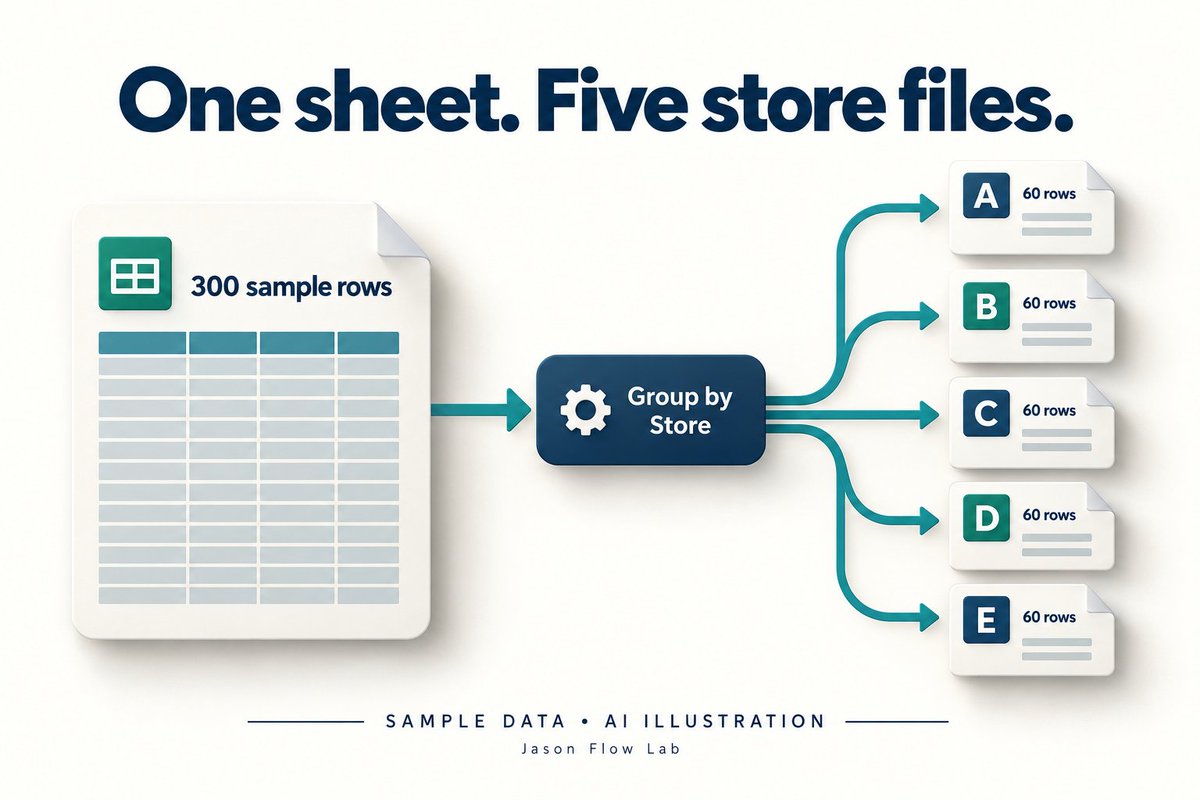
Demo with sample data:
Input: 300 order rows in one Excel file.
Process: Python groups by Store and exports each group with headers.
Output: 5 store files, 60 rows each. All 300 rows accounted for.
What do you split manually: stores, regions or customers?
Using AI to build an Excel report?
Pick one total. Trace it back to source rows, then check the formula and date range. A polished dashboard is not proof the number is right.
Which part of your reporting workflow is hardest to verify?
Before removing duplicates in Excel, ask: what makes a row unique?
The same order ID can appear on several valid line items. Choose the key columns, then review flagged rows before deleting.
Need a repeatable cleanup workflow? Reply with the sticking point.
A customer ID like 00124 isn't a quantity.
When importing CSVs into Excel, set ID columns to Text before loading. Formatting later won't restore zeros already lost.
Which spreadsheet field keeps breaking your reports?
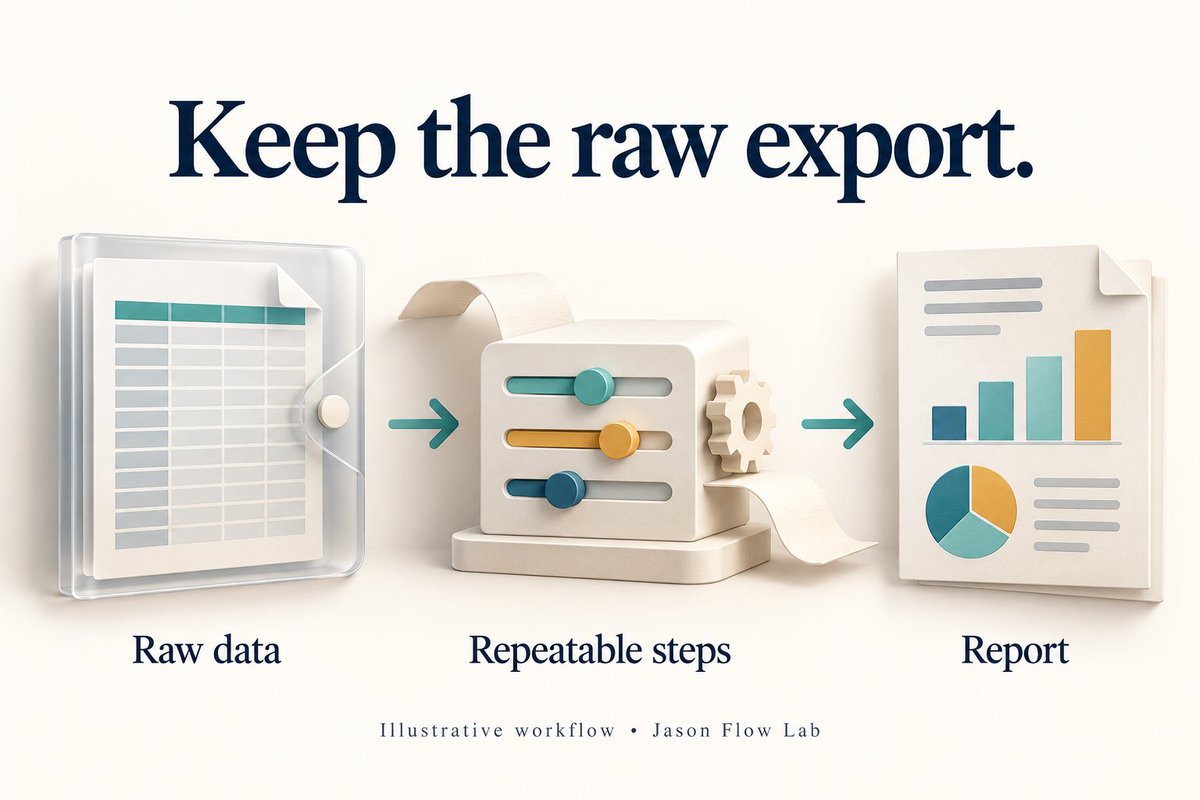
Still cleaning the same Excel export every week?
Keep the raw file untouched. Put cleanup rules in Power Query or Python, then refresh the report from the cleaned output.
Which recurring spreadsheet task would you most like to stop doing by hand?
Your monthly report shouldn't hide the rows it couldn't match.
When combining Excel files, keep an exception list for unmatched IDs and missing lookups—not silent blanks.
Which step in your reporting process still needs a manual check?
Automating a weekly report with Python?
Make every run leave a trail:
• Input file name
• Rows processed
• Start/end time
• Errors to review
A simple run log makes troubleshooting easier when an export changes.
Need help automating a report? Reply below.
@snwubble A product table with unique item codes and a separate fee table can make this easier to maintain. Are the extra fees charged per item, per order, or as a percentage? That determines how the totals should calculate.
A sales total rarely tells the whole story.
Which products are growing? Which channels are slowing? When did performance shift?
Before adding charts to an Excel dashboard, decide what your team needs to act on.
What would you want yours to answer?