Splunk has acquired @JavaPlumbr and agreed to acquire @TeamRigor, two companies with deep expertise and intellectual property that extend our end-to-end observability solution to be the most comprehensive, practical and proven in the industry. Read on to learn more. #splunkconf20
We are excited to share that Plumbr has been acquired by Splunk! Here's the announcement in our blog: https://t.co/iaRCd8EcMG
Additional context by Tim Tully, Splunk CTO: https://t.co/6ogwIKhiQr
Looking forward to having virtual threads in the JDK. In addition to performance improvement, their performance will also be easier to monitor as they use existing Java abstractions (unlike RxJava, Reactor, etc).
New UX metrics from browsers coming soon to Plumbr:
* Largest Contentful Paint
* First Input Delay
* Cumulative Layout Shift
Any other metrics that you would like to see? Let us know!
More info here:
https://t.co/yexcpJsXml
When hiring accountants, do you ask them if they do some extra accounting in their free time?
When hiring plumbers, do you ask whether they have some plumbing side-projects to demonstrate their passion for the job?
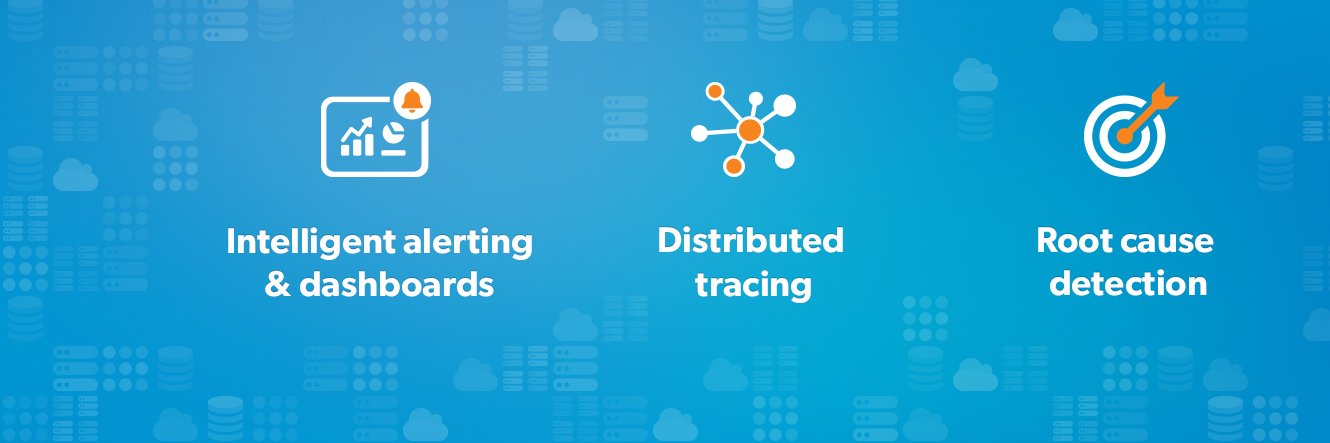
What are the “three pillars of observability”?
–> Metrics, logs, and distributed traces
How do you achieve a holistic three-pillar monitoring solution with Plumbr?
–> https://t.co/uw2RnCYy93
We have some exciting product news - Plumbr can now automatically explain *every* bottleneck in your Java code that makes your application or API slow: https://t.co/uq7xXtxpQn
I'm no expert in this area, but I've read a bunch of JVM GC tuning guides and I think @JavaPlumbr's Java GC handbook is easily the best: https://t.co/Fw6xopXVN2
Have applications or APIs that are implemented in #python? Want to be notified when they have impactful errors or performance bottlenecks?
Plumbr can now also be used with Python applications: https://t.co/By3M6bO2zQ
Tracing is an excellent means to gain observability to your application during runtime. We make adopting tracing as simple as possible - check it out via https://t.co/nSdiJftHYe
Performance modelling can be a daunting exercise. See a practical example how using system monitoring and tracing allowed to build and verify the model to be used in up- and downscaling the service - https://t.co/BQe4Jh8VeF
Apparently there are usecases where poor performance is desirable - like "shadowbanning" users via deliberately adding sleep(5000) for the request processing from such users - https://t.co/pDj6lkGgaQ