@dangaristo Simon found issues involving similarities between R vs P data for different materials (SiS2, SnS2, and OCS). The similarities are such that it is very difficult to understand how these datasets could be independently measured in the lab. See https://t.co/QchZjXuaWs. (8/8)
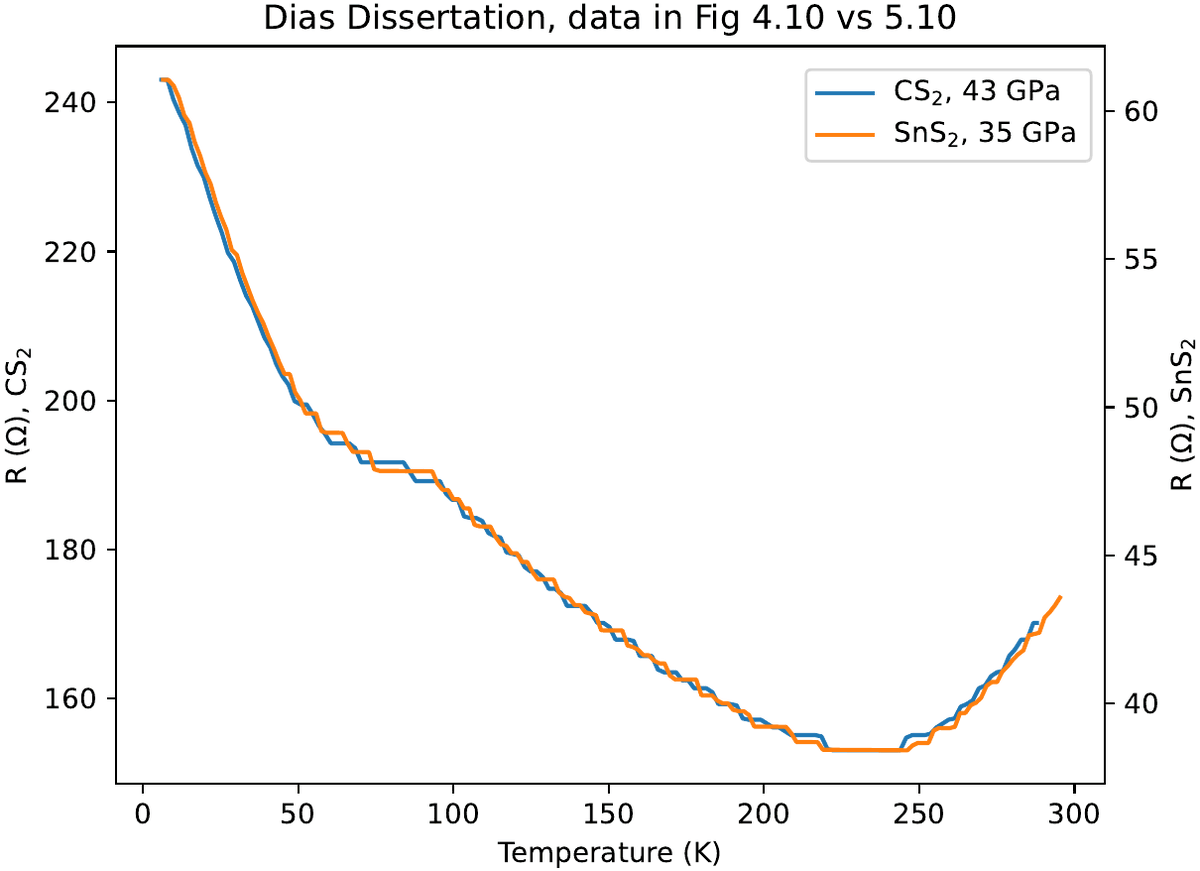
@dangaristo I found that the 43 GPa R vs T data for CS2 in Fig. 4.10 was identical, but for a scale factor of 4, to the 35 GPa data for SnS2 in Fig. 5.10. This is illustrated in the figure here, where both data sets have been plotted on different y-axes of same graph. (7/8)
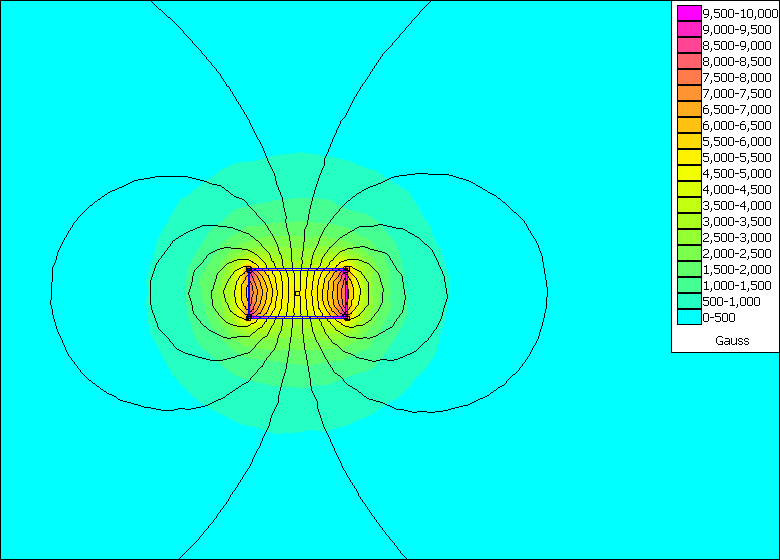
@BFieldSource@Robotbeat@andrewmccalip 15 years ago I spent about 4 hours thinking I'd discovered a new high Tc for exactly that reason. It was FM, but remnant field of QD MPMS was simply locking in a negative magnetization during zero field cooling. 2/2
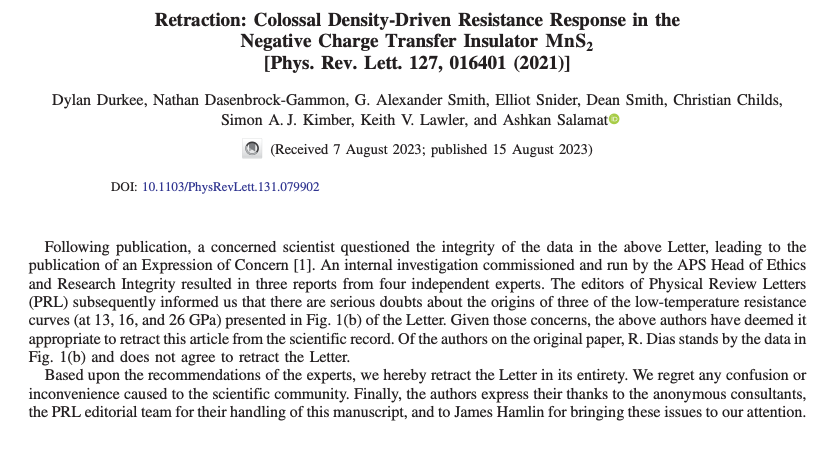
The paper
“Colossal Density-Driven Resistance Response in the Negative Charge Transfer Insulator MnS₂”
has been retracted by 9 of the 10 authors.
Letter: https://t.co/D1W2t2OSJg
Retraction: https://t.co/be95kRCHrK
@VanGennepD@Kaju_Nut On your second point I think it was the _claims_ of the original paper that were trusted by many. That trust seemed not to hinge on any expert analysis of the data.
I was able to closely mimic the “levitation” behavior of LK-99 with a ferromagnetic sample.
For comparison, see the original LK-99 video in the tweet below.
A superconductor optimized for strong pinning is inside the liquid-nitrogen-filled styrofoam cup. The levitating "puck" is a permanent magnet.
Apologies that I can not recall the name of the speaker who brought this to WUSTL Physics around 2010!
https://t.co/p0WAiAwrrs