Are low-income residents disproportionately moving away from transit? New paper by @JeffAllenMaps with @FarberSteven, Dan Silver, and I uses a panel dataset of tax filers (1988 to 2018) in Toronto and finds “Yes, but…”
In a new City Beats blog, @geo_uoft's @jasonhackworth9 & our Data Viz Lead @JeffAllenMaps examine the factors causing housing lots to be abandoned in American rust belt cities: deindustrialization, taxation & the pressures on Black-majority neighbourhoods: https://t.co/Up3g8iKf8e
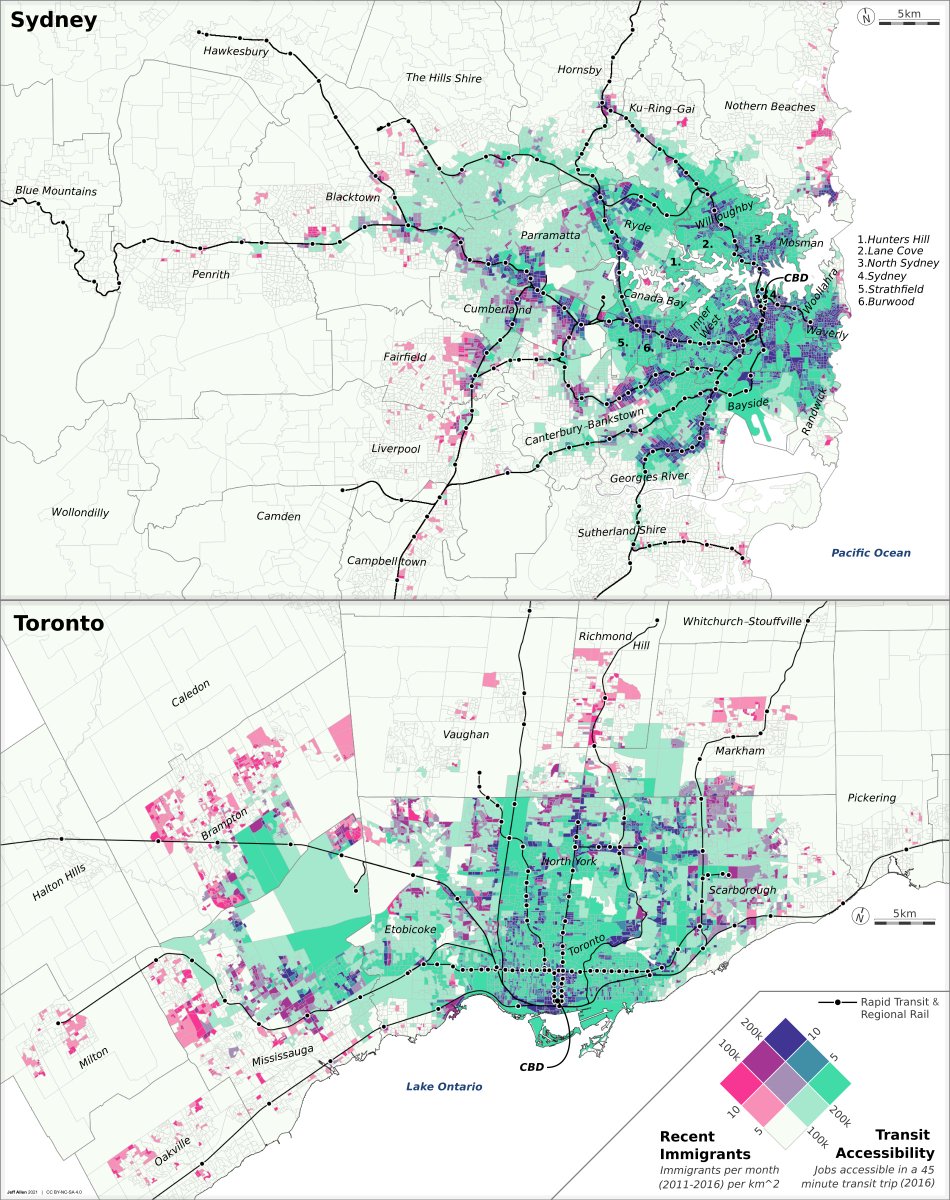
map of immigration and transit accessibility in toronto and sydney
(made this a couple years ago, looking at it again now for a tutorial on bivariate maps :)
Interested in mapping Canadian census data but not sure where to start? @JeffAllenMaps wrote a brief tutorial on understanding census data, where to download it, and making simple maps using CensusMapper and QGIS. Learn more at https://t.co/84di0LACt4 #Mapping#CensusData#Canada
Curious to see where and how many secondary and backyard suites are in #Toronto? @JeffAllenMaps and @ajalmusa mapped permit data to track the uptake (or lack thereof) over the past 10 years.
Check out our story here: https://t.co/5xkIfFSSuP
Interested in the past and present of #Toronto's landscape? Our Data Viz Lead @JeffAllenMaps has updated our web app for viewing and comparing historical aerial photographs with air photos from 1947 (sourced from @MDL_UofT).
Check out more here: https://t.co/wDcROE7To0
Interested in Toronto history? @JeffAllenMaps made a simple website for viewing and comparing historical aerial photographs in #Toronto.
Check it out here! https://t.co/wDcROE7To0
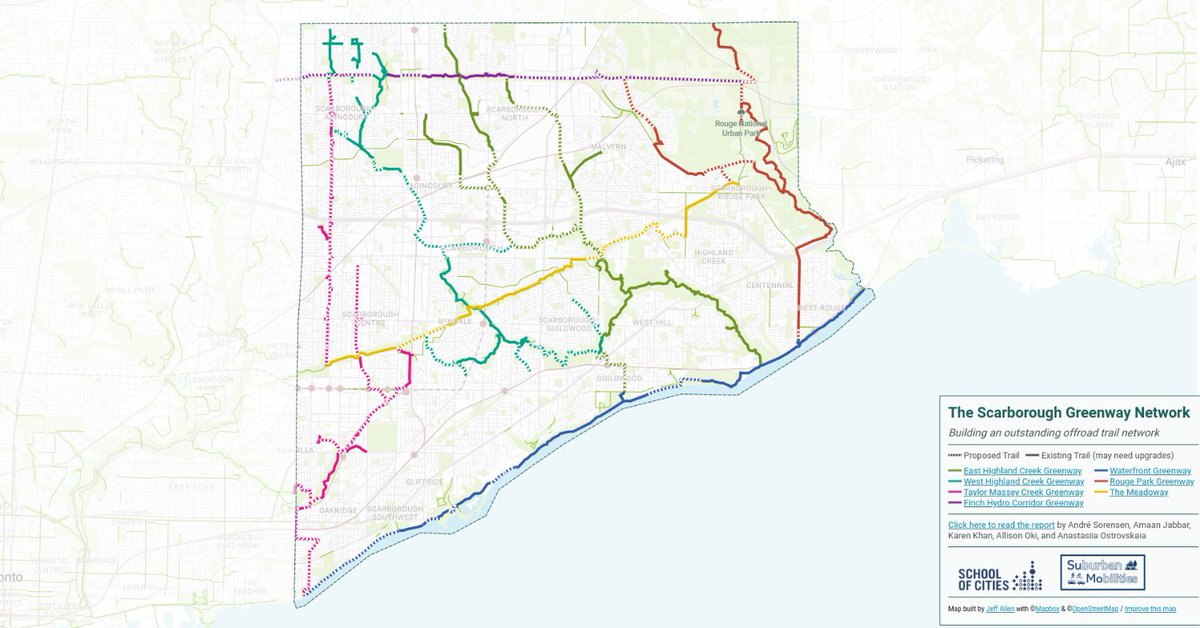
As a bonus, the School of Cities' Data Viz Lead (@JeffAllenMaps) created an interactive map of The #Scarborough Greenway Network.
Explore: https://t.co/gm5foShlMG