It’s easy to focus on what AI produces. But also think about what it consumes.
Going forward, our economy will be increasingly levered against construction, electricity, land, maintenance, and water.
It’ll be a very different mix than any economy the world has previously seen.
I spoke with the New York Post @nypost on Monday about future paths in the war with Iran.
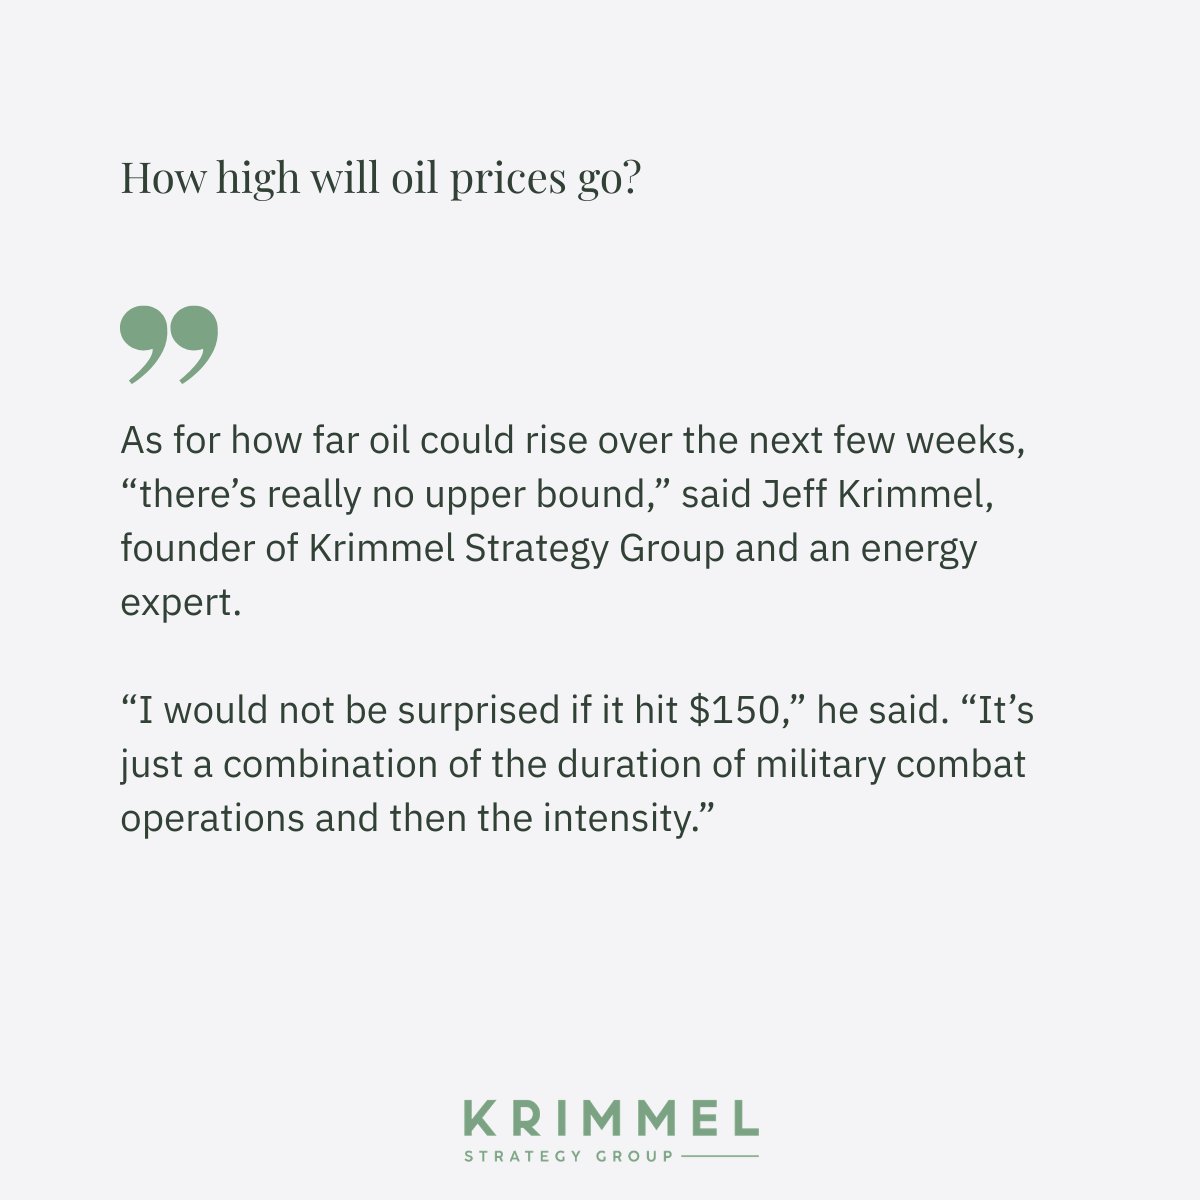
We started with the question everyone wants to know: how high will oil prices go?
======
As for how far oil could rise over the next few weeks, “there’s really no upper bound,” said Jeff Krimmel, founder of Krimmel Strategy Group and an energy expert.
“I would not be surprised if it hit $150,” he said. “It’s just a combination of the duration of military combat operations and then the intensity.”
======
Some highly-regarded analysts publicly dismissed $100 oil. Prices surpassed that level Sunday night.
The longer the Strait of Hormuz remains inaccessible, and the more production that gets shut in across the Middle East, the greater the likelihood of an even higher spike becomes.
❗ At one point, oil prices raced more than $40 per barrel above pre-war levels. That matters at the pump.
======
For every dollar increase in oil prices, there is typically a 4-cent increase in gasoline prices – meaning a $40 jump in crude could hike prices at the pump by $1.60, according to Krimmel.
======
That kind of energy cost shock redirects consumer spending, slows economic growth, and makes it harder for the Fed to cut rates.
That’s stagflation.
How does this compare to the 1970s oil embargo? There are some profoundly important differences.
======
The US also produces much more oil today than it did in the 1970s, and global economies have somewhat diversified away from fossil fuels, Krimmel said.
======
A quick price recovery is possible if military operations wrap up within the next couple of weeks.
But if combat drags out and the US is truly committed to regime change in Iran, that scenario becomes much harder to imagine.
G7 nations are exploring a potential release of crude reserves to blunt the market pain. But there are limits.
======
The relief would ultimately be short-lived, however, as there aren’t enough oil reserves in the world to make up for the complete blockade of the Middle East, according to Krimmel.
=====
And then after my conversation, we heard the competing statements from President Trump that “the war is very complete, pretty much” and then later “we’re going to go further”.
The market is quickly gaining confidence that an end is near, with US oil prices now below $85 per barrel, around $30 lower than its highs on Sunday night.
As we’ve seen plenty of times over the past 10 days, we should exercise caution in extrapolating what’s happening right now into the future.
📌 Any of these market realities can flip entirely with one statement from the US president.
China watched oil prices spike over 50% this week. This is exactly what they’ve been preparing for.
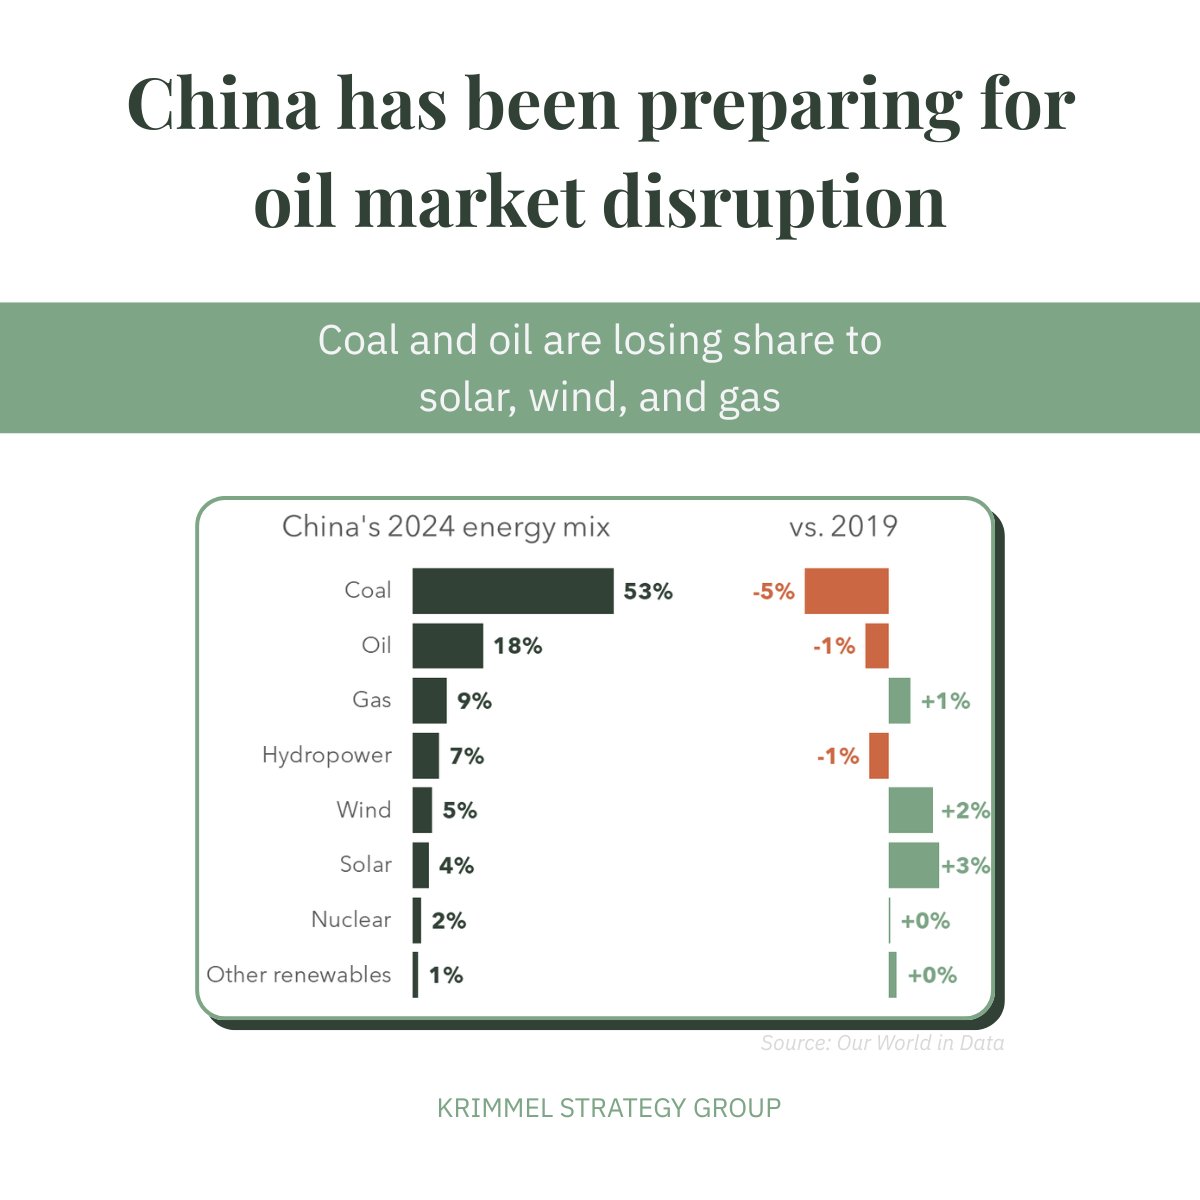
The chart below shows how China's energy mix has shifted over the past 5 years.
Coal is still responsible for over half of China's total energy, but its share has dropped 5 points since before the pandemic.
Likewise, the Chinese economy depends less on oil today than it did 5 years ago.
The same is true for hydropower, but that number varies based on changes in annual rainfall.
📌 Notice in which direction China is shifting its energy mix:
➜ Solar is +3 percentage points
➜ Wind is +2
➜ Gas is +1
While nuclear hasn't moved much, that story is more about how many facilities are actively under construction. Nuclear's increased contribution will come on the back end of all the construction activity.
China is also building new coal-fired power plants, but these are mostly for back-up purposes. They rarely enter baseload operation.
Energy security sits at the center of China's strategy.
What happens when your economy relies on oil imports?
A foreign power launches combat operations in the Middle East, and your energy costs spike over 50% in a week.
China has decided that degree of exposure is unacceptable, which is part of the reason solar and wind figure so prominently in their calculus.
🗺️ There is no Strait of Hormuz that can constrain the amount of sun falling on, or wind blowing across, mainland China.
And then China has increasing amounts of energy storage, and coal, gas, and soon nuclear power plants, to build out its generation footprint.
It’s worth remembering that while oil's share of China's energy mix is smaller than it was five years ago, China's aggregate oil demand is higher now than it was then.
Total energy consumption has simply grown more quickly than oil consumption.
And with the central government aggressively incentivizing the manufacture and domestic sale of electric vehicles, that gap will likely widen.
➡️ The next domino: the point at which Chinese oil demand flatlines and eventually starts to fall, like we've seen in the US, Europe, and Japan.
For now, China is enjoying taking on a bit less pain than it would have had this Middle East conflict happened even 5 years ago.
US oil prices hit $110 per bbl, up over 60% in the past 9 days.
On Friday, February 27, the day before the US and Israel initiated combat operations in Iran, WTI was at $67 per barrel.
In its first 15 minutes of trading on Sunday evening, it hit $110.
The oil price futures curve is one of the cleanest examples of an acute supply disruption you’ll ever see.
Crude for April delivery hit $110 per barrel.
For December? $75.
Still, the December price is $10-15 per barrel above its pre-war level.
The market is positioning for a conflict whose duration is far from certain.
As I’ve written before, I’m curious what kind of hedge positions operators are taking.
A range of open questions is driving this price spike:
→ Will the Trump administration insist on “unconditional surrender”, or will it accept less?
→ Will the Trump administration maintain that Iran war aims are “far more important” than what happens to energy prices?
→ When will traffic through the Strait of Hormuz resume?
→ For how long will the UAE, Kuwait, and other Gulf producers shut in production?
→ Even if the US adopts a less aggressive military posture, will Israel follow suit?
The first week of the war produced far more questions than answers.
That’s why the spike didn’t come on day one. It came in time, as markets realized the uncertainty wasn’t narrowing.
Oil prices for near-term delivery are up $10 from a month ago. For crude producers, that math is worth billions.
We covered oil futures curves in two recent sessions of Oil & Gas Market Mastery. And those sessions happened to bracket the initiation of military action in Iran.
I shared with the group how the futures curve shifted. That's the chart below.
The price of crude for April delivery is now $10 per barrel higher than it was a month ago.
December delivery is $3 per barrel higher.
If you took Oxy's average production level for US crude in 2025, these higher prices would translate into an incremental $1 billion of revenue, much of which carries through to the bottom line.
📌 With total production of 13.7 million barrels per day, US crude producers in aggregate would generate over $20 billion in additional revenue in 2026 because of this price spike.
There's an important part of this hypothetical profit story that we'll only learn about in hindsight: how many of these producers are hedging their future production?
I expect those board-level conversations have been happening continuously as the conflict has unfolded.
Hedging is one of the mitigating factors against price spikes further out in the futures curve.
While today's oil prices are still far below 2022 levels, they're the highest we've seen since the middle of 2024.
This kind of price move translates into real profit dollars for producers.
🔎 The question now is how many are locking these gains in while they are available, and how many are rolling the dice.
China bought roughly the same amount of LNG in 2025 as it did in 2020. Cheniere $LNG hopes that’s about to change in a big way.
Cheniere reported earnings last week. In their presentation, they forecast China’s LNG demand growing at a 12.7% CAGR from now to 2030, after five years of being flat.
The logic behind the reversal is worth understanding.
Cheniere expects Asian LNG prices from 2026 through 2030 to be roughly half of what they were from 2021 through 2025.
That kind of substantial gas price reduction will drive more demand.
The argument is that as more LNG export capacity is built in the US and elsewhere, LNG supply goes up.
If LNG supply goes up more quickly than LNG demand, prices will fall.
And given the large volume of new LNG export capacity approved and mostly under construction, this new LNG supply is coming.
Still, China is the most important unknown variable across a number of the world's critical energy equations.
China’s relatively weak oil demand growth is one reason investors are concerned about stranded oil production assets, which drives a lot of the capital discipline we’re seeing across the upstream sector.
China’s aggressive push to electrify, while diversifying its power generation fleet, is a big part of why potential oil and LNG demand growth are each under pressure.
On the oil side, we have electric vehicles as a headwind.
On the LNG side, we have coal, nuclear, solar, wind, and batteries as headwinds.
And China is ramping up its domestic oil and gas production, displacing imported hydrocarbon volumes across the board.
Knowing energy security is a key consideration of the Chinese central government, it’s easy to see why they prefer to steer toward their own domestic resources.
That posture doesn't go away because LNG prices fall.
Cheniere's forecast isn't unreasonable.
But it's also a forecast where most of the variables need to break the right way: lower prices, demand response, and limited domestic substitution.
And they need to do so simultaneously.
That's the risk profile underpinning the 12.7% CAGR forecast.
Ovintiv $OVV is selling $3B in Anadarko assets. Two reasons: one operational and one financial.
First: operational fit.
The advantages of consolidation don't accrue the same way when you're spread across multiple plays.
What works best in Canada or the Permian may not translate to Oklahoma.
Second: debt.
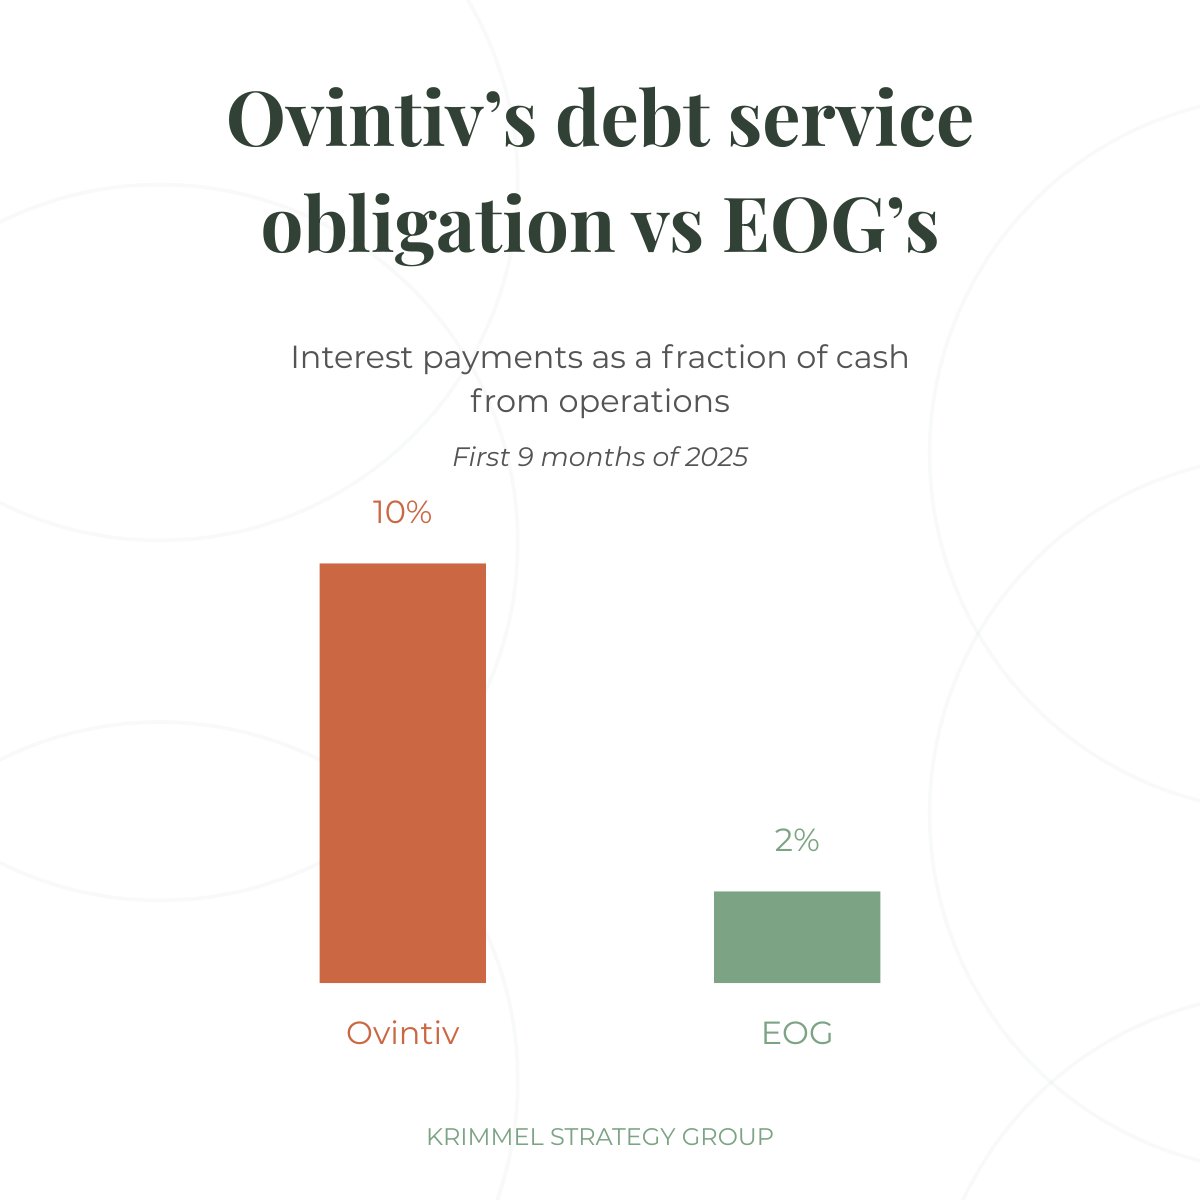
Ovintiv's interest payments consumed 10% of cash from operations through the first 3 quarters of 2025.
$EOG's? 2%.
That 5x gap is a meaningful constraint, and a significant motivation for the sale.
Consolidation is the directional push investors want.
But in some cases, asset sales are how you get into position to actually deliver on that expectation.
Chevron moved its HQ to Houston. Now Expand Energy is doing the same.
The intuitive expectation: as the world moves away from fossil fuels, legacy energy hubs fade.
The opposite is happening on the US Gulf Coast.
Nuclear. Hydrogen. Carbon capture. Sustainable aviation fuel. LNG.
The list of new energy developments concentrated along the Gulf Coast keeps growing, leveraging the region's 100-year foundation as an energy focal point.
US natural gas prices just got a 25% "winter storm" premium in the latest EIA outlook.
The EIA now sees 2026 prices significantly higher than it did just 30 days ago.
Why did one storm drive such a sharp move in a long-term forecast?
It’s a classic case of the Supply-Demand Timing Gap. I’m walking through the mechanics of what this means for the sector in tonight’s Krimmel Letter.
🗂️ Also in this issue:
→ The Buyback Retreat: Why bp $BP, Equinor $EQNR, and TotalEnergies $TTE are hitting the brakes.
→ OFS Strategy: NOV $NOV and the power of segment-level diversification.
→ Career Strategy: Why asymmetric bets are the only way to scale in energy.
Join 2,000+ energy executives, investors, and operators who receive this every Sunday.
Click the link in my bio to subscribe.
Most professionals would work hard for a guaranteed outcome.
Careers almost never work that way.
We discussed this in a recent coaching call I hosted.
Almost all the career value lives in uncertain outcomes, and whether you're willing to do the work for the CHANCE at something great.
The best career move you can make: place asymmetric bets.
Limited downside. Incredible upside. No guarantees.
A quesetion we all need to ponder: what's the next asymmetrical bet we're willing to place?
$BP stock dropped 6% on Tuesday.
$XOM and $CVX were flat.
The reason?
bp suspended buybacks and "retired" their 30-40% cash return guidance.
Investors sent a clear message: if you can't return cash to shareholders, your equity story is broken.
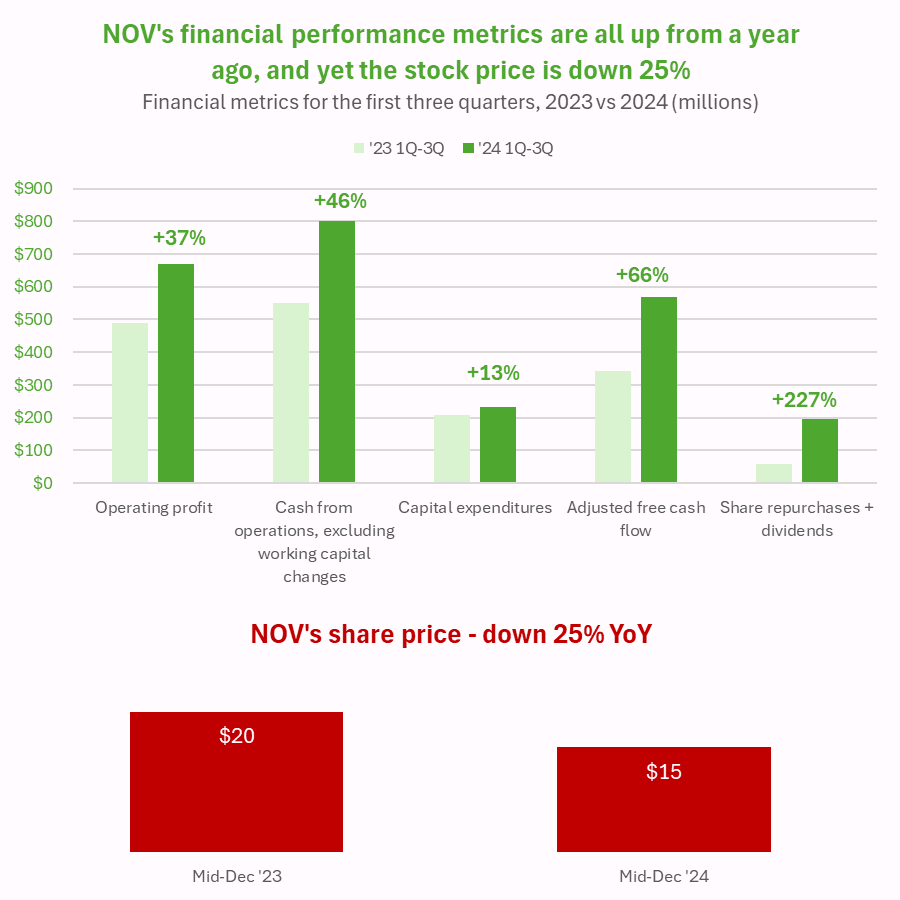
$NOV's Q4 results show why OFS diversification matters:
→ Energy Equipment (offshore/production): +4% revenue
→ Energy Products & Services (land/drilling): -7% revenue
Long-cycle backlog insulates you from short-cycle volatility.
$SLB and $HAL are learning the same lesson.
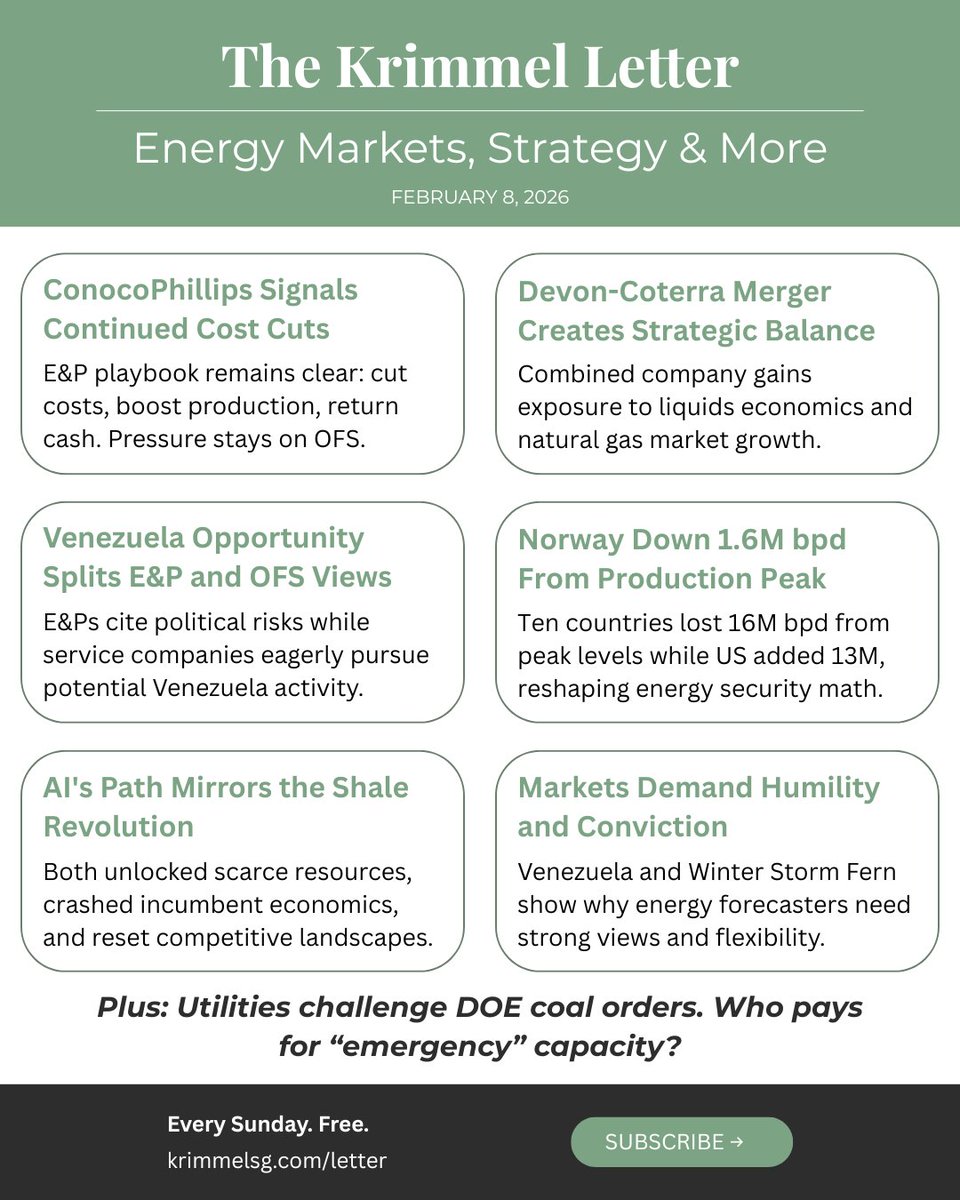
DOE ordered coal plants to stay online. Utilities are pushing back. Ratepayers are getting the bill.
Who wins when reliability mandates collide with market signals?
New Krimmel Letter breaks it down, plus $COP earnings, Devon-Coterra, and global production gaps.
https://t.co/W4xZWk2RgL
You want to see how perverse OFS can be in one chart?
NOV’s financial performance is up YoY. Its stock price is way down.
Managing your business is only half of the oilfield service (OFS) game.
The other half?
Navigating turbulent global market waters.
Best of luck out there.
$NOV
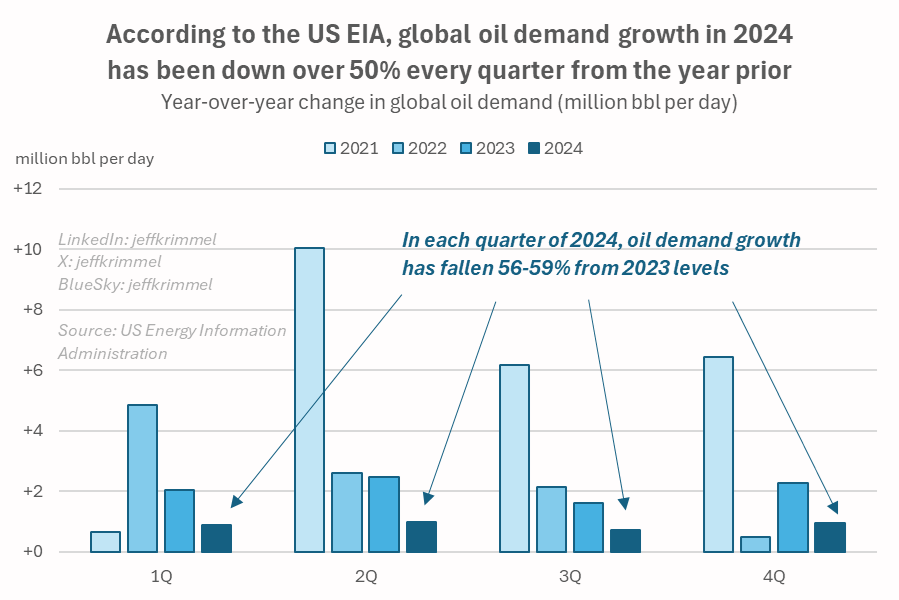
Global oil demand growth has slowed dramatically in 2024.
Each quarter, demand growth has been less than half 2023 levels.
It's a big reason oil prices are near 2024 lows, and also why "drill, baby, drill" may have nearly no impact on actual US production levels.
@JKempEnergy has a great chartbook out today.
When it comes to energy, we transition away from very little.
The chartbook is titled “Global wood fuel and the energy transition”. I put a link to it below.
As John writes in his email newsletter (which I recommend you subscribe to)…
“Continued growth in consumption of wood fuels illustrates that the energy transition has so far been characterised by the addition of new forms of energy rather than the replacement or substitution of older ones.”
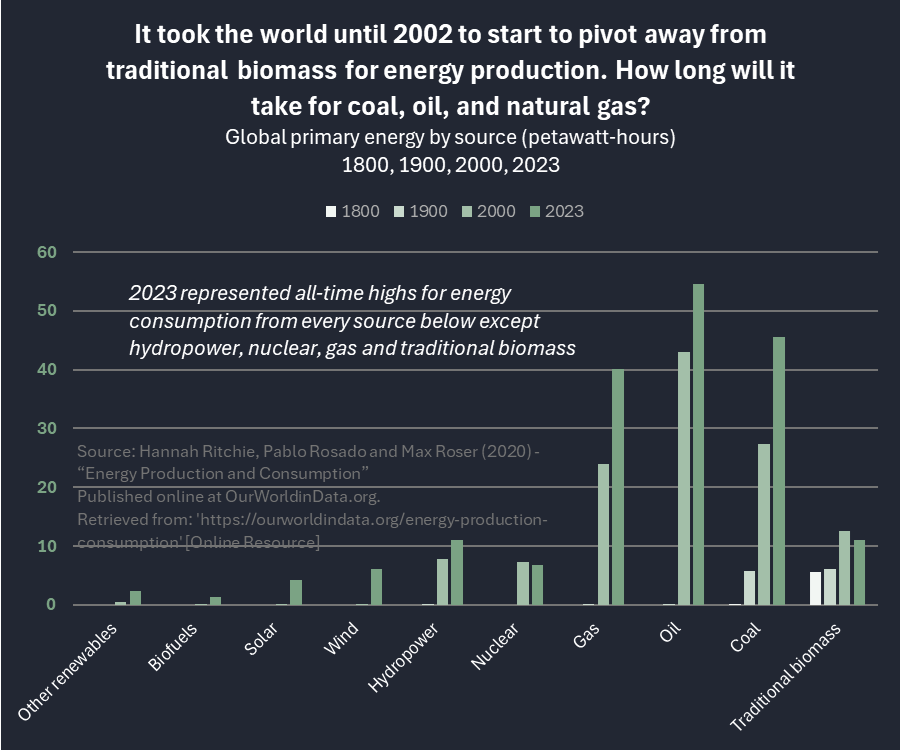
That led me over to Our World in Data, where a post by @_HannahRitchie, Pablo Rosado, and @MaxCRoser Roser had some really interesting energy production data going back to 1800. I also put a link to this piece in below.
We see here that all energy sources produced more energy in 2023 than they did in 1800, 1900, or 2000, with the exception of traditional biomass, which hit its peak in 2000.
According to Our World in Data, the world harvested more energy in 2023 than it ever has from oil, coal, wind, solar, biofuels, and other renewables.
The ones that were below their historic peak in 2023? Hydropower, nuclear, gas and traditional biomass.
The first three of those are just temporary lulls.
Hydropower is incredibly sensitive to global precipitation patterns, and thus its generation levels are historically volatile.
Nuclear is back on the rise, with new plants under construction mostly in eastern Europe and Asia Pacific.
And as electric loads continue to grow in the developed world, and as solar power needs a longer-term backstop than batteries alone can provide, we’re already seeing more momentum around new natural gas installations.
Even an ancient, primitive energy technology like wood combustion has only fallen about 10% off its historical peak generation levels.
And with global oil and coal consumption at record levels, and natural gas consumption not far off, it’s not clear we’re going to see the demise of fossil fuels any time soon.
Shell and Equinor are combining their UK North Sea assets.
It's one more example of how oil & gas majors are seeking to find their footing through the energy transition.
https://t.co/RPSV4oa6zs
@optionstraps I see it's down 9% today.
I just don't see how they make it all that close to their targets. The small-scale schedule slips they've already experienced are a bad sign.
$OKLO is a nuclear power company whose stock is booming.
It's backed by Sam Altman and Chris Wright - high-profile folks.
I wrote 3,100 words about Oklo and the broader US nuclear power sector.
I also review Kerrisdale's recent short report.
https://t.co/5nBXWUROkz