There's one setup so reliable it quietly minted a generation of millionaire traders.
3 to 5 days. That's how long the real move usually takes.
Miss the start and you miss almost all of it.
Here's exactly what it looks like 👇
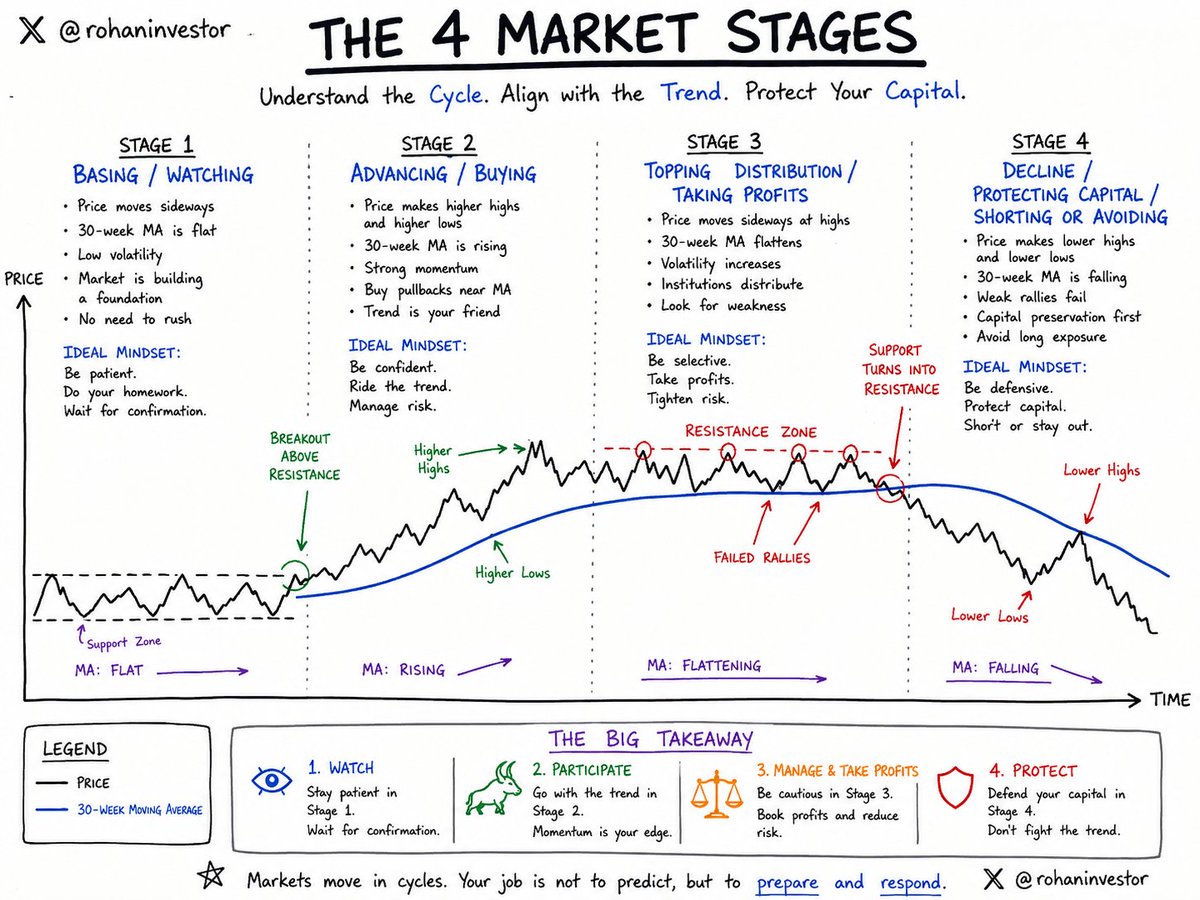
Buying is the easy half. Selling a winner is where the money is actually made or lost.
The old masters used a 20-signal checklist for it.
I do it with one moving average and two rules.
Here's the system 👇
1/ Why does the market sometimes move sharply even when there's no major news?
One reason is dealer hedging.
Changes in options volatility can force dealers to buy or sell the underlying asset, creating moves that have nothing to do with headlines.
Brief post with code "A Common Sense Guide to Volatility Trading": "The edge is knowing whether the vol is genuinely rich, whether it is stretched far enough in its own range to snap back, and how rough the trip will be when it does." https://t.co/7niqBpNu2Y
Most traders jump straight to BUY.
Professionals follow a process.
My MAEE Formula keeps trading simple:
M - Market Structure
A - Area of Value
E - Entry Confirmation
E - Exit Plan
No guessing.
No FOMO.
Just a repeatable framework that improves decision-making.
If this helped, please Like ❤️, Repost 🔄, and Follow @ChartMantra_ for more visual trading guides.
What's the one step most traders skip? 👇
هذا فلتر يساعدك في اقتناص الأسهم من القاع عند عودة السوق للإرتفاع باستخدام موقع Finviz
عندما يغير السوق اتجاهه ويتحول إلى "سوق صاعد" (Bullish)، حيث تظهر أوضح الفرص غالباً من خلال عمليات الفرز (Screens) البسيطة عن طريق Finviz.
يعرض هذا الفرز الأسهم التي وصلت لمرحلة "تشبع بيعي" شديد، ولكنها لا تزال تظهر قوة على المدى الطويل.
فلاتر الفرز (المعايير):
مؤشر القوة النسبية (RSI): في منطقة التشبع البيعي (Oversold).
القيمة السوقية: 2 مليار دولار فأكثر.
السعر: أعلى من المتوسط المتحرك البسيط لـ 200 يوم (200 SMA).
الأداء السنوي: أداء إيجابي خلال عام واحد.
رابط الفلتر:
https://t.co/KWaqni8qI3
استراتيجية بسيطة لرصد بداية الموجة الصاعدة
استراتيجية تجمع بين الاتجاة والزخم للبحث عن
الشركات التي تستحق المتابعة 🌹
طبقها واعطيني رأيك صديقي المضارب .
ان اعجبتك ادعم التغريدة حتى نضع لكم كل
جد��د باذن الله 🤍
#سوق_الاسهم_السعودية #تاسي
Most traders see a failed breakout and walk away.
I see something different.
A failed breakout isn't always a failed trade.
If buyers defend the breakout level, price forms higher lows, and selling pressure dries up
the second opportunity can offer a better risk-to-reward than the first.
The best traders don't chase every breakout.
They wait for the market to reveal who is really in control.
Would I take this trade?
Yes - but only if price proves demand is still present.
📈 Price is God.
📊 Volume is Power.
🛡️ Risk Management is the Holy Grail.
What's your decision?
YES or NO? More importantly... WHY?
Let's discuss. 👇
8 CHART PATTERNS YOU'LL WISH YOU LEARNED SOONER.
Bookmark this. Number 6 is the one that quietly funds the others.
Every pattern below is the same thing: a picture of buyers and sellers fighting. Learn to read the fight, not the shape 👇
99% of traders think an Inside Bar = Tightness.
That's one of the biggest mistakes in price action.
Real Tightness isn't just a small candle. It's when:
✅ Price stops making meaningful progress after a strong uptrend.
✅ The trading range contracts dramatically.
✅ Volume dries up.
✅ Selling pressure disappears.
This is where institutions quietly accumulate before the next expansion.
Compression - > Expansion.
The tighter the base, the more explosive the potential breakout.
Study this note carefully. It can completely change how you identify high-probability setups.
❤️ Like if you learned something. 🔖 Bookmark for future reference. 🔁 Repost to help other traders. 💬
What's the tightest setup on your watchlist right now?
🧵(1/4) Let's demystify the RSI indicator.
Most RSI explanations start with momentum, overbought and oversold conditions. That language is familiar, but it hides a simpler way to understand what RSI is doing.
In the AdaptiveRSI framework, RSI can be read as normalized price position around a moving-average equilibrium. The 50-line is not just the middle of the oscillator. It is the level where price equals its smoothed reference point.
This is the first shift: RSI is not only something that moves between 0 and 100. It is also a compressed description of where price is positioned.
#RSI #AdaptiveRSI
Bookmark this RSI Cheat Sheet.
Not because it is a magic signal table, but because it compresses several years of RSI experiments, mistakes, and research into one compact map.
The levels are not hand-picked.
They are calculated reference zones for reading RSI across different lengths.
That matters because RSI length is not just an input.
It changes the entire reading problem.
Traders switch from RSI(14) to a non-standard length, and then keep reading the indicator with the same old 70/30 map.
That is the mistake.
Changing RSI length does not just change how fast the line reacts. It changes
--> the range
--> the frequency of extremes
--> the time spent near 50
--> the meaning of the same levels.
A level that appears often on a short RSI can become rare on a longer RSI, and a reading that looks normal on one length can become meaningful on another.
So the better question is not only:
“Which RSI length should I use?”
It is:
“How should this RSI length be read?”
If the reading problem changes, the map should change too.
#RSI #AdaptiveRSI
ما تيجي نحلل مؤشر الدولار بما إنه المحرك الأساسي للاسواق في الوقت الحالي 👇
حنعتمد في التحليل على قالب بولينجر ... اللي بيتكون من
1) مؤشر Bollinger Bands على الرسم البياني
2) مؤشر b% اللي بيقيس الافراط في الشراء والبيع
زي ما هو واضح من الرسم البياني اليومي ... إن مؤشر الدولار USD Index بيحترم حدود قناة بولينجر جدا ... وبيعكس اتجاهه في كل مرة يلمس فيها الحد العلوي أو السفلي للقناة
حاليا هو لمس الحد العلوي للقناة ... يعني احتمال كبير يكون بيستعد للهبوط
كمان كان فيه فجوة سعرية ما بين يومي 17 و18 يونيو ... وهو في الغالب (من خلال دراسة تاريخه) بيحب يغطي الفجوات السعرية كمستهدفات
الخلاصة
أنا شايف إن مؤشر الدولار بيستعد عشان يهبط لأسفل من 101.5 ... ويرجع يغطي الفجوة السعرية عند 99.9
هبوط الدولار المتوقع معناه صعود متوقع للذهب والفضة والـ EURUSD واحتمال البيتكوين