None of us are home until all of us are home.
I am raising money to help end homelessness by walking in solidarity in Walk A Mile in My Boots.
Donate here: https://t.co/Hoz45KFmRh
All donations made today will be DOUBLED.
More about Hutt St Centre: https://t.co/oyAAVjHDHe
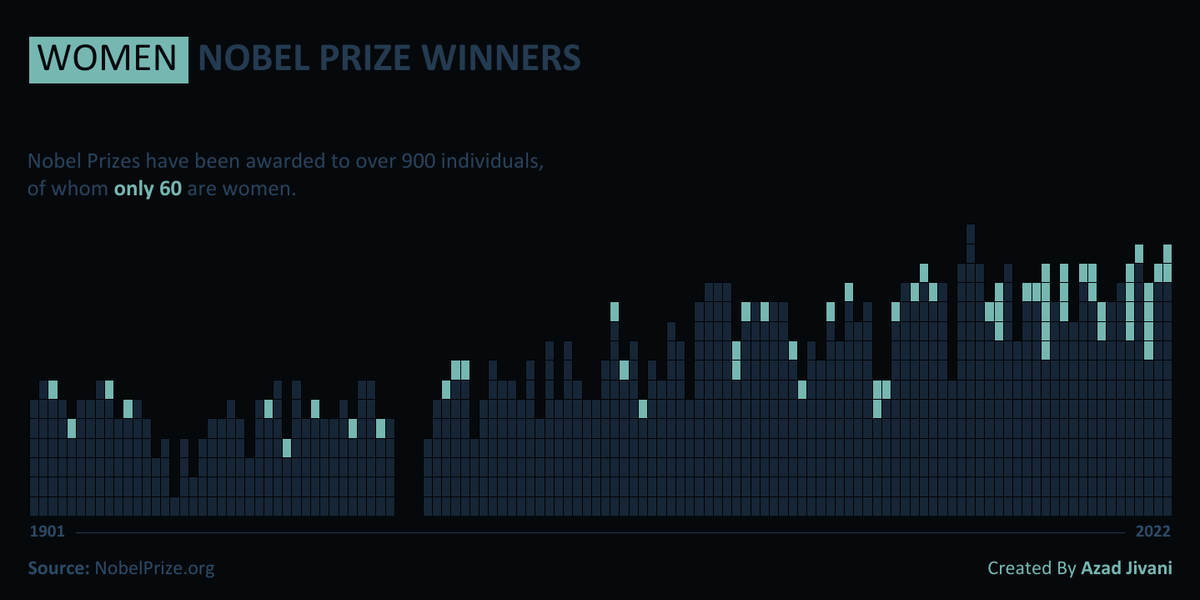
#B2VB 2023 Week 5 (Timeline) - Nobel Prize
Nobel Prizes have been awarded to over 900 individuals since 1901, of whom only 60 are women.
Here is my #tableau viz - https://t.co/4LSZ2Mfufn
#datafam#dataviz#datavisualization
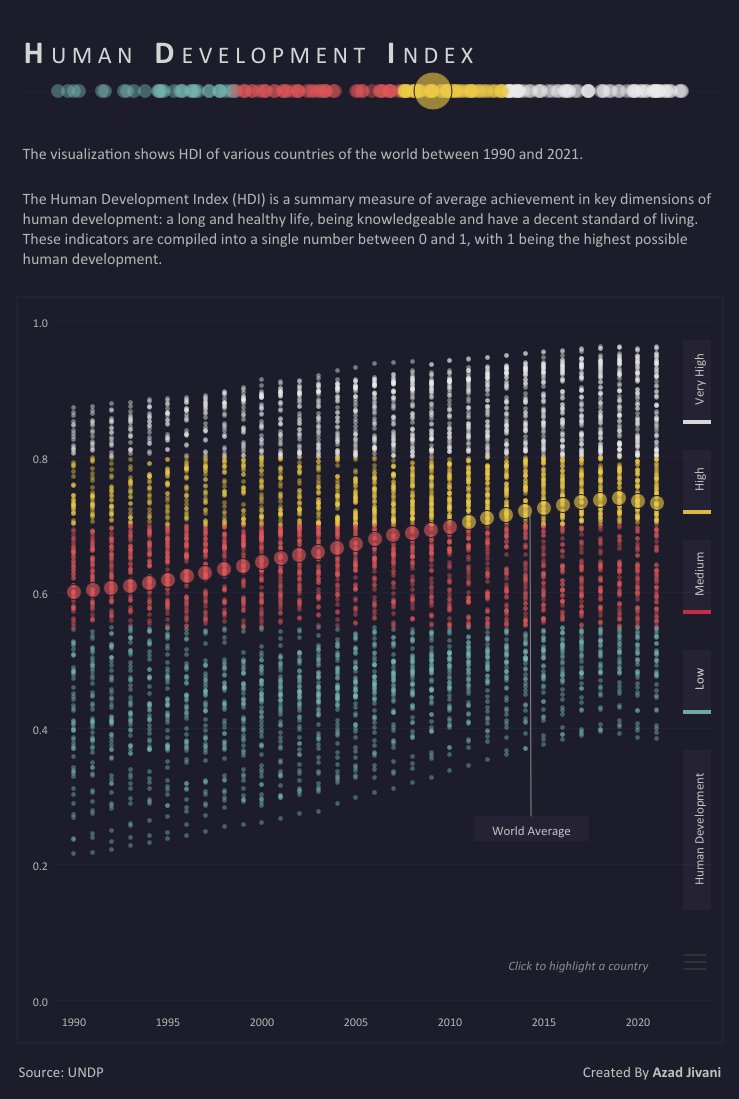
#MakeoverMonday 2022 Week 41 Human Development Index
The visualization shows Human Development Index (HDI) of various countries of the world between 1990 and 2021.
Here is my #tableau viz - https://t.co/QKcRBQkAbO
#datafam#dataviz#datavisualization
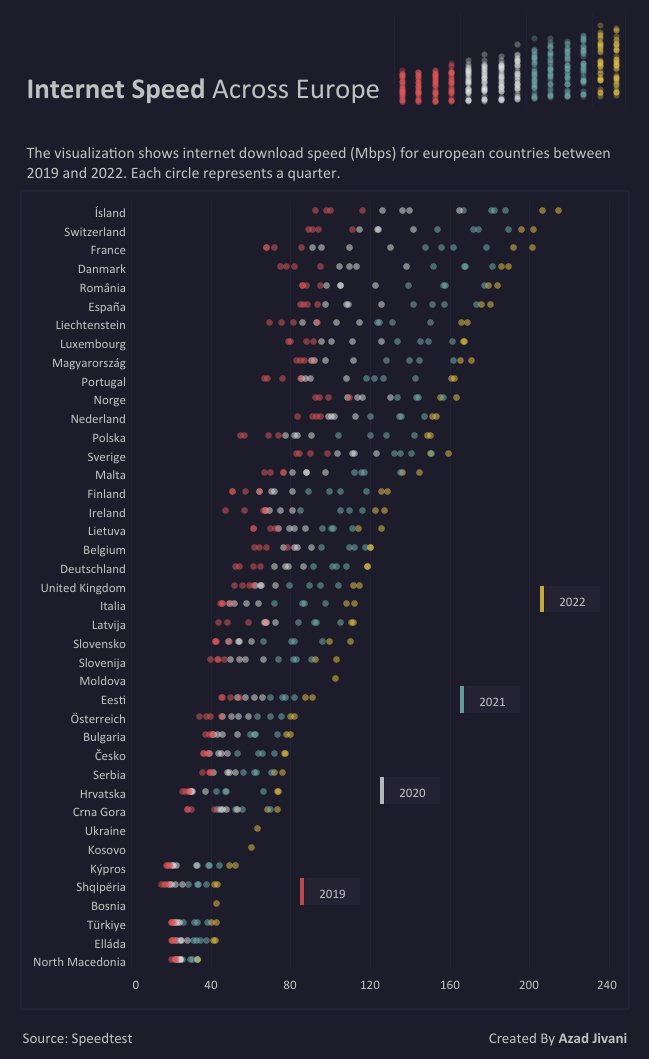
#MakeoverMonday 2022 Week 39 Internet Speed
The visualization shows internet download speed (Mbps) for european countries between 2019 and 2022.
Here is my #tableau viz - https://t.co/WlFxkkUCSu
#datafam#dataviz#datavisualization
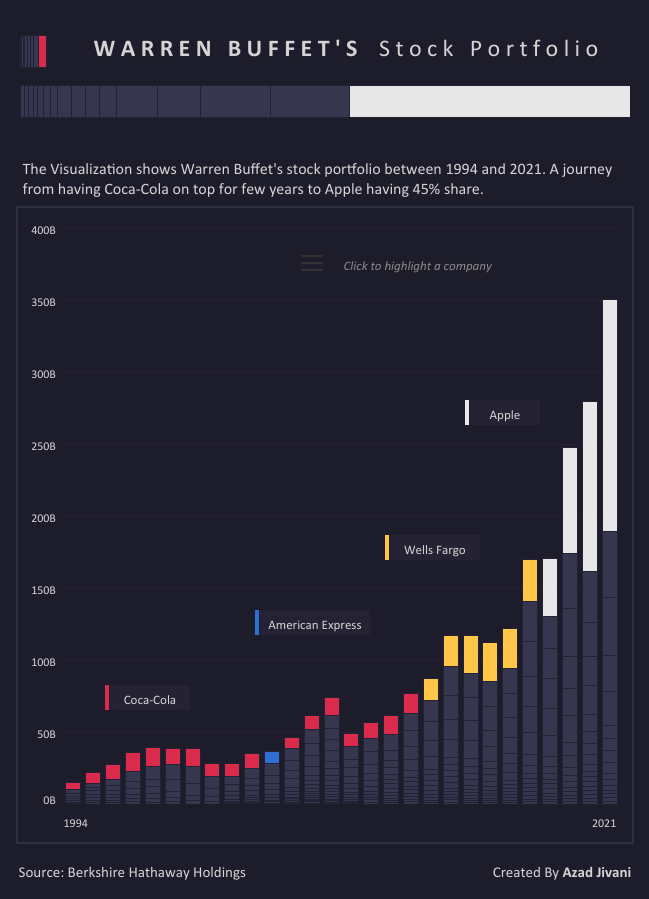
#MakeoverMonday 2022 Week 37 Warren Buffet
The Viz shows Warren Buffet's stock portfolio between 1994 & 2021. A journey from having Coca-Cola on top for few years to Apple having 45% share.
Here is my #tableau viz - https://t.co/kIuJA01VPw
#datafam#dataviz#datavisualization
@Dandee_House Instead of showing 2006-2010 and 2015-2019 opposite to each other, maybe try to overlay later year on top of previous year on same direction upwards. For better comparison & clear indication of the shift on the right towards higher age..
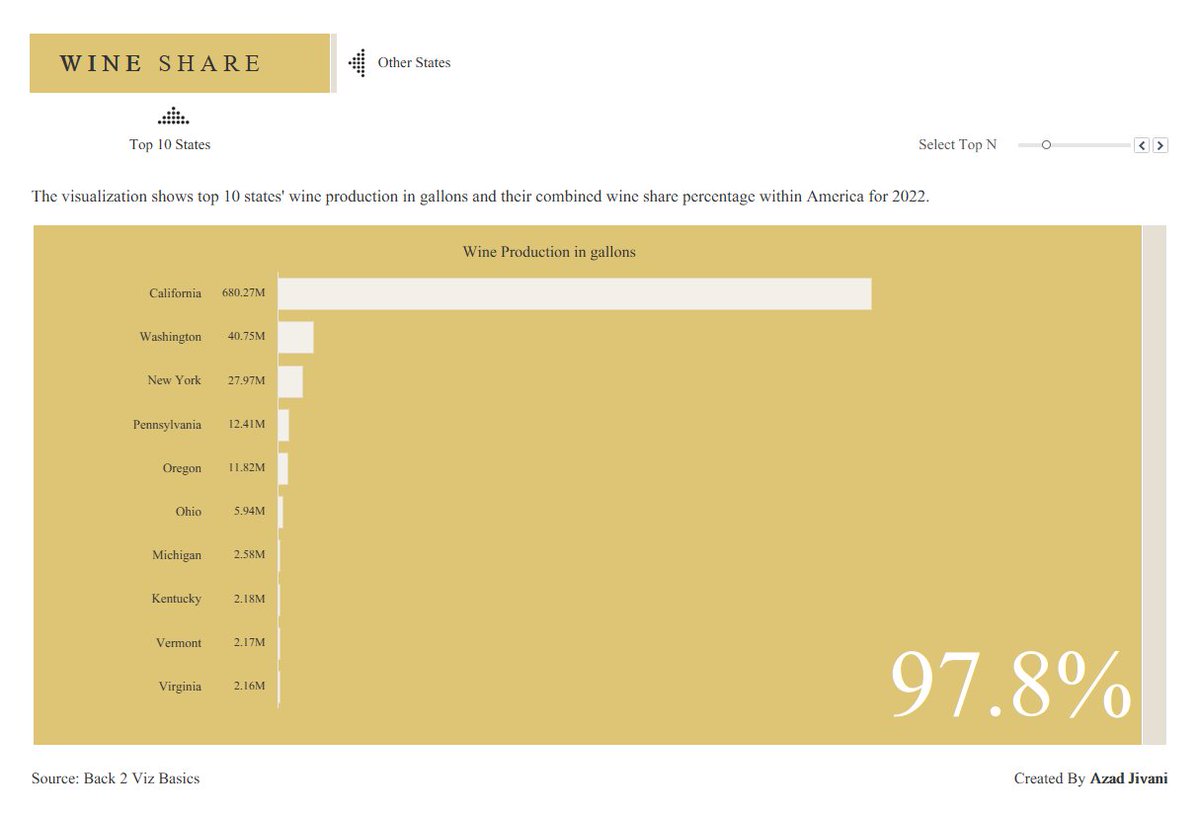
#B2VB 2022 Week 11 - Wine Share
Here is my take on Using Sets for Top N challenge. Top 10 states produced 97.8% wine within US for 2022.
Do you see different fonts than in pic on tableau public?
Viz Link: https://t.co/Sq08Kr2ccB
@tableau@tableaupublic@ReadySetData#DataFam