⚠️ solana:J3NKxxXZcnNiMjKw9hYb2K4LUxgwB6t1FtPtQVsv3KFr: SMART MONEY DIVERGENCE AT ALL-TIME HIGHS ⚠️
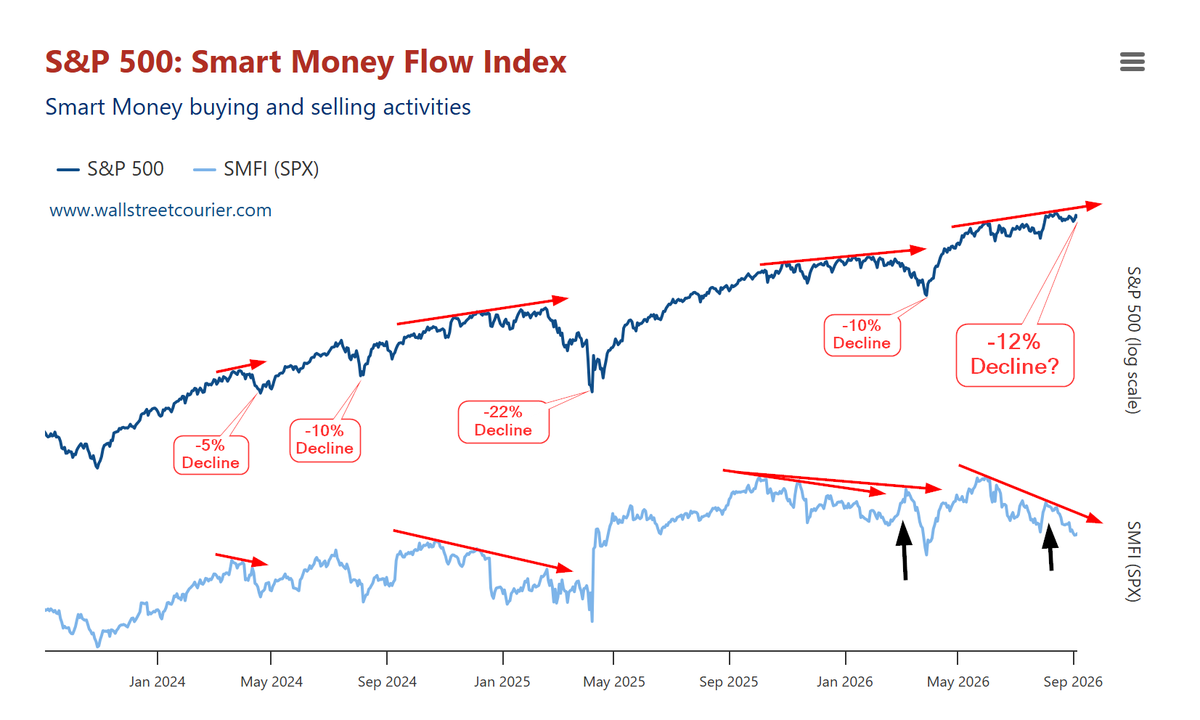
The chart reveals a three-year institutional footprint of how smart money behaves directly at major S&P 500 peaks.
THE HISTORICAL BLUEPRINT
📊 12% AVERAGE DECLINE: Over the last three years, when these institutional divergences developed at tops, they triggered an average market decline of 12%.
📉 HISTORICAL RANGE: Declines ranged from a shallow -5% pullback up to a severe -22% drop in March last year.
🩸 SELLING INTO STRENGTH: The pattern repeats. A sharp rise in smart money flow preceded the prior drop as institutions methodically sold into price strength before dumping positions completely.
THE CURRENT WARNING
Price is trading right near all-time highs, yet smart money is pulling out aggressively under the surface.
When institutional flow diverges this sharply at the highs, risk is skewed to the downside. Trade disciplined and follow JCS-Charting for institutional-grade positioning. 💸🔥
Data by @WallStCourier
#SPX $SPY #FinTwit #SmartMoney #DayTrading #TechnicalAnalysis #JCSCharting
$SPX DAILY MARKET HEALTH: EXTREME BEARISH SENTIMENT + RISING BREADTH = SQUEEZE FUEL 🚀
While the crowd is panicking over index-level weakness, the underlying market internals are flashing a classic contrarian setup.
THE INTERNAL DIVERGENCE
EXTREME BEARISH SENTIMENT: AAII sentiment has turned heavily bearish over the past three weeks (pushing above 51% bears), showing retail is positioned defensively for more pain.
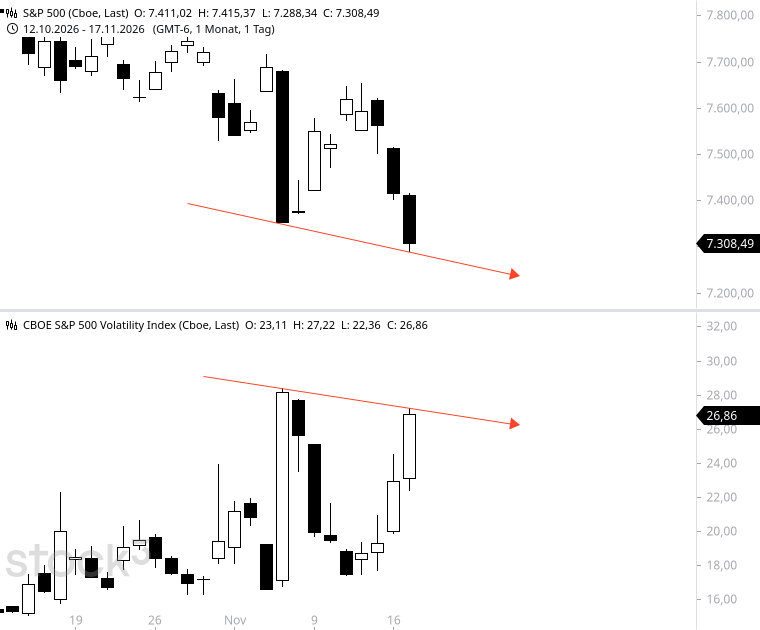
HEALTHY & RISING BREADTH: Beneath the surface, breadth has been steadily recovering since the mid-September NYMO lows. Even after printing that index low around 7,300, advancing stocks have consistently outnumbered declining stocks.
HEAVYWEIGHT DRAG ONLY: The headline index pullback is strictly heavyweight-driven, masking broad participation across the rest of the market.
When sentiment sits at extreme pessimism while internal breadth quietly strengthens, you have the exact textbook invitation for a massive short squeeze.
$SPX $SPY $ES_F $NYMO #MarketInternals #MarketBreadth #AAII #ShortSqueeze #FinTwit #PriceAction #JCSCharting
⚠️ $NDX WEEKLY: THE 85-WEEK CYCLE PEAK TIMING WINDOW OPENS ⚠️
The Nasdaq 100 has officially entered the timing window for a major macro 85-week cycle peak, and the historical track record demands serious attention.
THE 85-WEEK HISTORICAL BLUEPRINT
📅 FEBRUARY 2025 PEAK: The last 85-week inflection struck dead-on in February 2025, triggering a punishing -27% decline.
📅 JULY 2023 PEAK: The preceding cycle high arrived in July 2023, delivering an immediate -12% decline.
📅 LATE NOV 2021 TOP: Going further back, the 2021 cycle top marked the major inflection that hammered the index down by over -37%.
⏳ THE TIMING WINDOW IS ACTIVE: This high-stakes timing cycle begins this week and remains active straight into mid/late-October.
Macro cycle tops don't ring a bell for the crowd, but they leave an unmistakable rhythm on the tape.
Track the exact weekly pivots, institutional roadmap, and downside triggers before volatility explodes at https://t.co/25klc5qMQ2. 💸🔥
$NDX $QQQ $NQ_F #FinTwit #MarketCycles #TimingWindow #TechnicalAnalysis #MacroTrading #JCSCharting
⚠️ $SPX SMART MONEY UPDATE: TEXTBOOK INSTITUTIONAL DISTRIBUTION ⚠️
This is exactly what an institutional distribution pattern looks like on the tape.
THE DIVERGENCE REALITY
📈 HEADLINE ATHS VS. INSTITUTIONAL SELLING: Since June, the S&P 500 has continued printing higher highs and new records, but the big money has been systematically dumping inventory into the move.
⏳ THE RESOLUTION TIMELINE: If anyone interprets this chart differently, they simply do not understand order flow mechanics. It is only a matter of time before this underlying distribution spills directly over to the index price action.
🌪️ OCTOBER, NOVEMBER RESOLUTION: Distribution of this magnitude does not resolve sideways. A sharp reckoning is lining up for the October, November window.
Smart money exits quietly before the floor gives way.
Data by @WallStCourier
$SPX $SPY #SmartMoney #Distribution #MarketInternals #FinTwit #TechnicalAnalysis #JCSCharting
⚠️ $NVDA MONTHLY: BIGGEST BUYING OPPORTUNITY WHILE THE HERD PANICS? 🚀
Everyone is freaking out right now, precisely when market structure offers the cleanest setups.
THE MONTHLY READOUT
📉 -39% OFF THE TOP: Nvidia flushed over 39% from its ATH into last week's lows, shaking out weak retail hands.
🎯 38.2% MACRO FIB NAILED: Price tagged the exact 38.2% retracement of its entire historical rally, measured from its market debut straight to the peak.
🔄 2024–2025 BACKTEST: That exact pocket aligns with a clean structural backtest of the former all-time highs from late 2024 and 2025.
Buy when everyone else is scared and freaking out.
🔥 Track the exact monthly levels and live roadmaps at https://t.co/25klc5qMQ2 🔥
$NVDA $NDX $SMH #Fibonacci #MarketStructure #FinTwit #PriceAction #TechnicalAnalysis #QQQ #JCSCharting