8/
The full analysis — 75 years of data, all 38 death crosses, the three that destroyed wealth, and what the current setup looks like historically.
https://t.co/31h4ec2Guf
⚠️Not financial advice.
Past performance ≠ future results.
7/
The crosses that destroyed wealth had two things in common:
1. Extreme spread depth (50MA fell 10%+ below 200MA)
2. A macro catalyst that was structural — not cyclical Oil crisis. Dot-com bubble. Credit system breakdown.
Watch for both. Not just the cross.
This is what systematic investing looks like in practice.
No emotion. No anchoring to last month's positions.
200 stocks ranked. The data decides what's in and what's out.
Full April portfolio Wednesday morning.
Free signals: https://t.co/H0N0c3kKuy
⚠️Capital at risk. DYOR.
🧵The LEVEL model rebalances Wednesday.
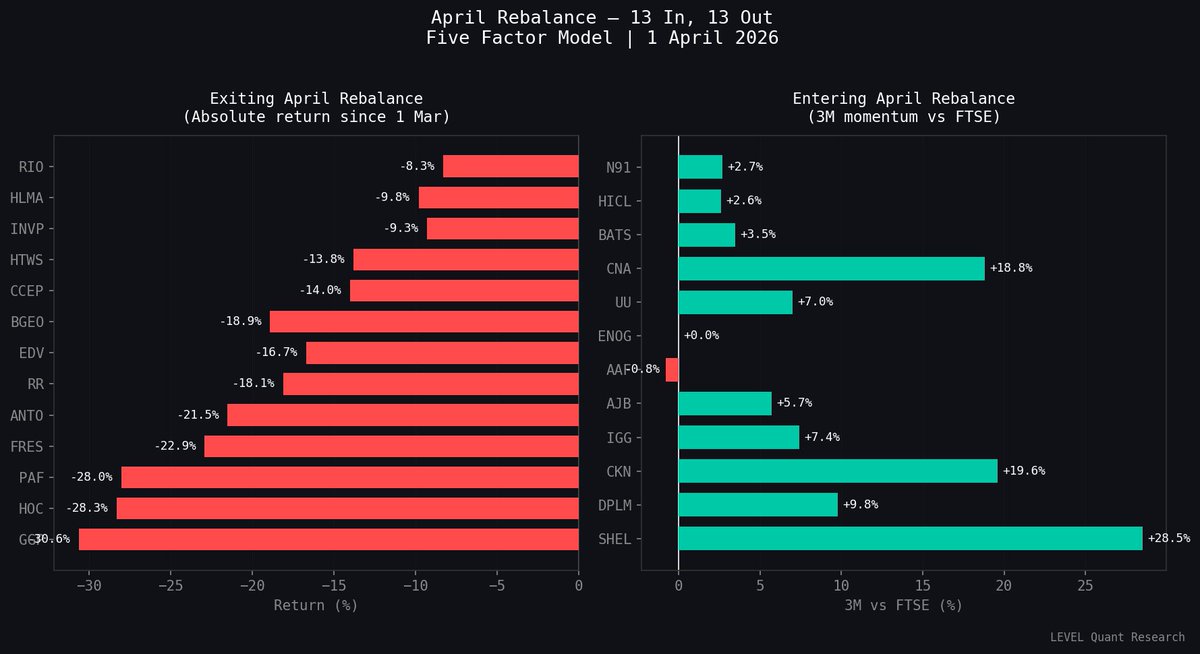
13 stocks out. 13 in.
The biggest rotation since launch.
Here's what happened in March and what the model is showing now.
13 stocks leaving on Wednesday. 13 new ones entering.
The exits — the miners and commodity plays that led in February.
The entries — Financials, Industrials, Utilities, Energy names with genuine 3M momentum vs the FTSE.
What happens on 1 April.
The portfolio rebalances.
New top 20 posted to both channels.
March's laggards exit.
New high conviction names enter.
Free daily signals: https://t.co/H0N0c3kKuy
⚠️Not financial advice. Capital at risk. DYOR.
🧵The LEVEL model portfolio is down 11.1% in March.
The FTSE is down 6.5%.
That's -4.6% excess.
Here's exactly what happened and what the data says about it.
The uncomfortable truth about systematic investing.
You will have losing months.
The 10-year backtest has losing years — 2008, 2011, 2014, 2022.
What matters is the process holds and you stay in long enough for the edge to compound.
+18.4% CAGR over 22y includes all the bad