And related to that, a pretty cool paper on the mechanism of Greenland blocking (that can lead to this extreme melt events) came out just recently: https://t.co/TxLCILKKj3
Turns out they do! Ongoing sever extreme melt events could increase SLR up to 20% in 2300 but only ice sheet simulation with a high temporal resolution (monthly ) show that.
Paper out in The Cryosphere 🎉
We revisit the temperature sensitivity of Antarctic precipitation which gives rise to simple scaling approaches in ice-sheet models. But which scaling factor should I take❓
https://t.co/7XQItVuVIg
Retreat of Brewster Glacier in New Zealand is revealing magnificent glacially-sculpted bedrock that might not have seen the light of day in thousands of years
Here I discuss these features
with expert filming by @bexparsonsking of @niwa_nz
@Monash_Science@MonashEAE@DLorrey
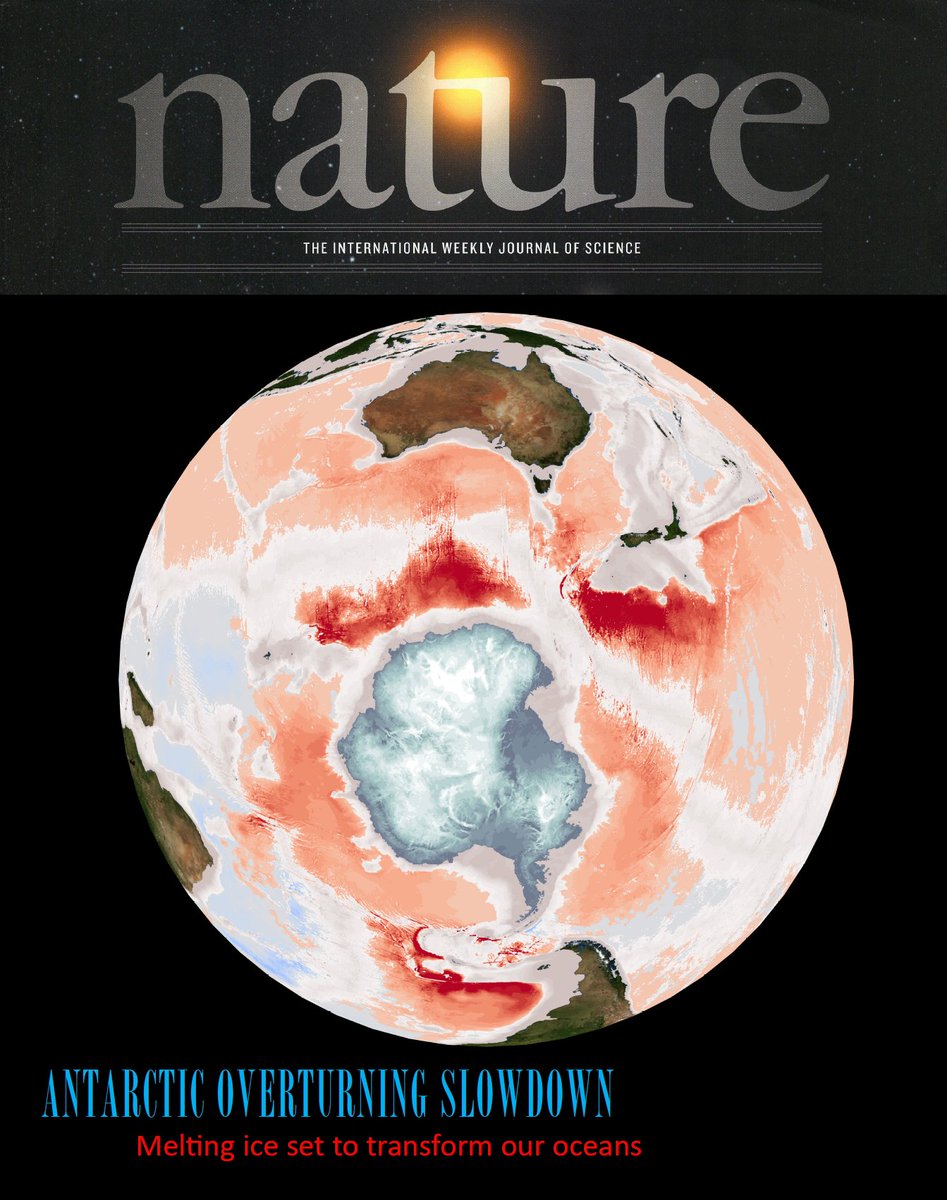
👉👉 Out today in @nature our new paper showing how meltwater increases around Antarctica are set to dramatically slowdown the Antarctic overturning circulation, with a potential collapse this century. https://t.co/p3au6k4zcK A🧵on how this work came about and what we found...
Speaking as an @IPCC_CH Lead Author, these are some of the most important new messages from the #climate report out today: (🧵)
1. For the first time we’re seeing evidence of real, sustained decreases in greenhouse gas emissions from some countries.
But take a breath because…
🔥Heat wave in Antarctica, +38 °C (+68 °F) above normal.
That's not an error, or a typo.
The remote research station at Dome C recorded a temperature nearly 40 °C above normal for this time of year, beating the previous March record by a startling 20 °C.
Here's the evolution of the 500hPa GPH over #Greenland during the recent extreme event ! Blocking centered over Greenland promotes the flow of warm and moist air over the ice, as in 2012 and 2019 ! thanks to @cambecc for the great tool ! @LamontEarth@EarthInstitute
I'm part of a paper now open for comment and review at @EGU_TC where we point out that not one of the 165 simulations of the latest, greatest, ensemble of projections for mass loss from the Greenland Ice Sheet reproduces mass loss as severe as observed for the last two decades.
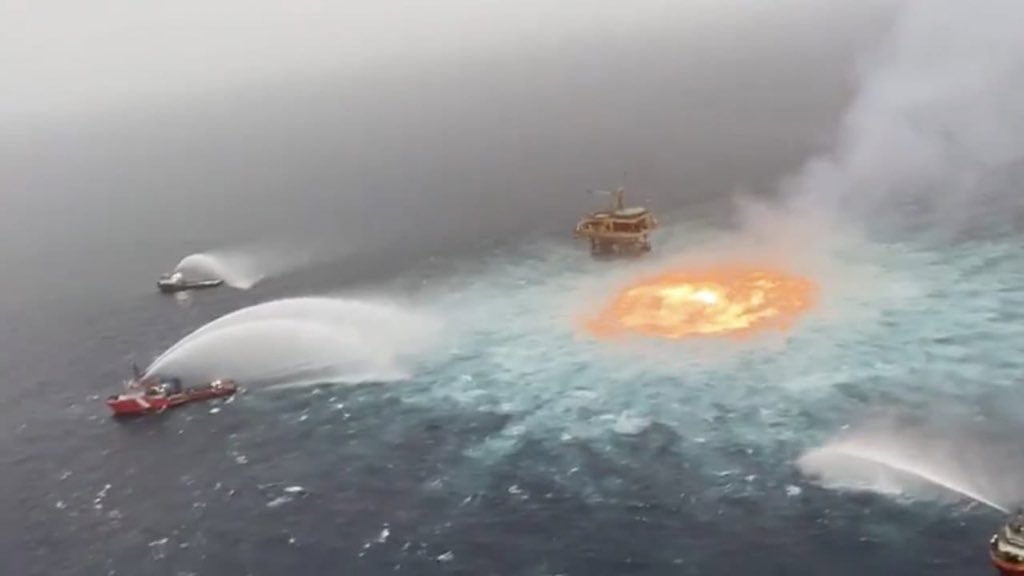
#GulfofMexico#GulfOfMexicoFire
Das Meer brennt. Eine riesige Pipeline ist im Golf von Mexico explodiert. Als ob sie das Tor zur Hölle im Ozean auftut.
Wie löscht man nun ein brennendes Meer?
Two dynamical perspectives on the NA #heatwave:
i. Anticyclonic wave breaking, forming an omega block.
ii. Amplified wave-4 in a strong, northward polar jet.
The latter might be linked to amplified land warming in NH high latitudes.
@LamontEarth@columbiaclimate@PIK_Climate
The heat dome over northwest America is just a part of a planetary wave number 4 pattern going around the whole northern hemisphere. I.e. 4 red areas with northward alternating with 4 blue areas with southward air flow aloft.