🚨JOB SUMMIT 2026 Q1🎉🎉
We’re going LIVE this Saturday, 30th May 2026 at 7PM with amazing HR Professionals @Halosznn_ and @Bethel_FOY 🔥
- Set your reminders NOW!
- You attending ? Drop a “YAYYYY 🎉or 🚀” in the comment.
If you’re serious about opportunities, growth, and leveling up your career journey, you do NOT want to miss this!
Check Thread for more details.
https://t.co/v053lxBGtn
BMW was a dream car for many of us growing up…
But is that dream the same worldwide?
And how is it evolving with hybrid & electric vehicles?
@BMW — data tells a deeper story when you look closely 👀
I explored this by analyzing BMW’s global sales data (2010–2024) using Excel 📊
@BMW Recommendations:
1. Scale hybrid & EV production to stay ahead of the transition curve
2. Adopt region-specific strategies (models, colors, fuel types) to match local demand
3. Focus on mid-range luxury segments for consistent revenue growth
@BMW 👉 While luxury defines the brand, it’s the mid-range segment that drives consistent revenue.
Key Insight:
analysis reveals that BMW’s growth is driven by a balance of global expansion, shifting fuel preferences, and strong mid-range market demand.
@BMW 4. Not All Models Perform Equally
The 7 Series stands out as the top-performing model, followed by models like the i8 and X.
5. The Real Money Is in the Mid-Range
Another key insight:
Vehicles priced between $30,000 and $110,000 dominate sales volume.
@BMW 3. The Shift Toward Hybrid Is Already Happening
One of the most interesting findings:
Hybrid vehicles account for the largest share of sales (~25%), slightly ahead of petrol, diesel, and electric vehicles.
@BMW https://t.co/F9CapCxZQQ Is Truly Global — But Asia Leads
Asia consistently leads as the top-performing region, with Europe and the Middle East following closely behind.
📊 This project reinforced something important for me:
👉 Data is not valuable until it drives decisions.
Full Project and methodology on my Github:
https://t.co/IQqOtG2Pct.
#DataAnalytics#Excel#AnalyticsPortfolio#DataStorytelling
I recently worked on a sales analytics project where I asked myself a simple question:
👉 What is this data really trying to say?
So I analyzed $2.2M in retail sales data and built a dashboard to uncover real business insights.
#analyticsportfolio
💡What I focused on in thisproject:
Turning raw data into clear insights
Identifying growth opportunities
Highlighting inefficiencies in pricing and regional performance
providing Recommendation that solves the business problems.
Building a clean,interactive dashboard in Excel
That last one changed my perspective.
I always assumed higher discounts = more sales.
But the data showed that deep discounts often reduce profit without delivering real growth.
The Discount Paradox: Analysis shows that deep discounting reduces profitability without a linear increase in sales. High sales at full price suggest strong products that should be prioritized
📍 And surprisingly — discounts don’t always increase sales
Category Dominance: Technology significantly outperforms Furniture and Other category in total sales.
Customer Concentration: Sales are heavily concentrated in California and New York, creating a risk if those market leaders experience disruption
What I found was interesting:
Key Observations & Insights
Regional Imbalance: The West Region is the powerhouse ($725k), while the South trails significantly ($391k), representing a major growth opportunity.
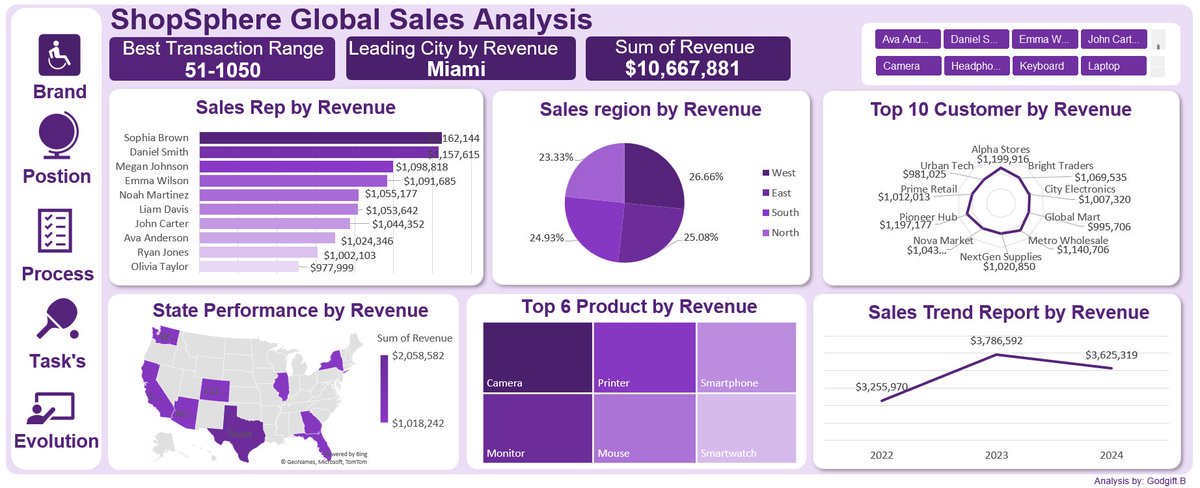
While studying at Vephla University, I am currently working on my ShopSphere Global Sales Analysis project, where I visualize a comprehensive overview of revenue distribution across regions, cities, products, customers, and sales representatives using Excel.
While studying @VephlaUni , I built my first interactive sales dashboard using Microsoft Excel to analyze and summarize key business metrics.This project challenged me to move beyond just working with data to actually deriving insights that can support data driven decision-making
@VephlaUni Design interactive dashboards using Excel
Turn data into meaningful business insights
This is my first step into data analytics, and I’m excited to keep learning and building more projects.
@VephlaUni 5..Strengthen customer retention strategies, like implementing loyalty programs and personalized engagement strategies to increase customer lifetime value.
🛠 What I Learned
Building this dashboard helped me:
Understand how to structure and clean data