What better way to start your new job by learning a bit about the demographics of the city you are working for? Done 'old-school' with the tools of @ladataviz, which is now even easier in @tableau 2024.2 🙏
https://t.co/A8PR0pu28F
#Datafam#Utrecht
@mfinaly Hey, thanks so much! And nice work. I created some vizzes using @ladataviz his tools, you could have a look at that. And you could consider telling your story using the data, I'm sure there's an interesting story to be found (for example why was nov 6 so good?). Good luck!
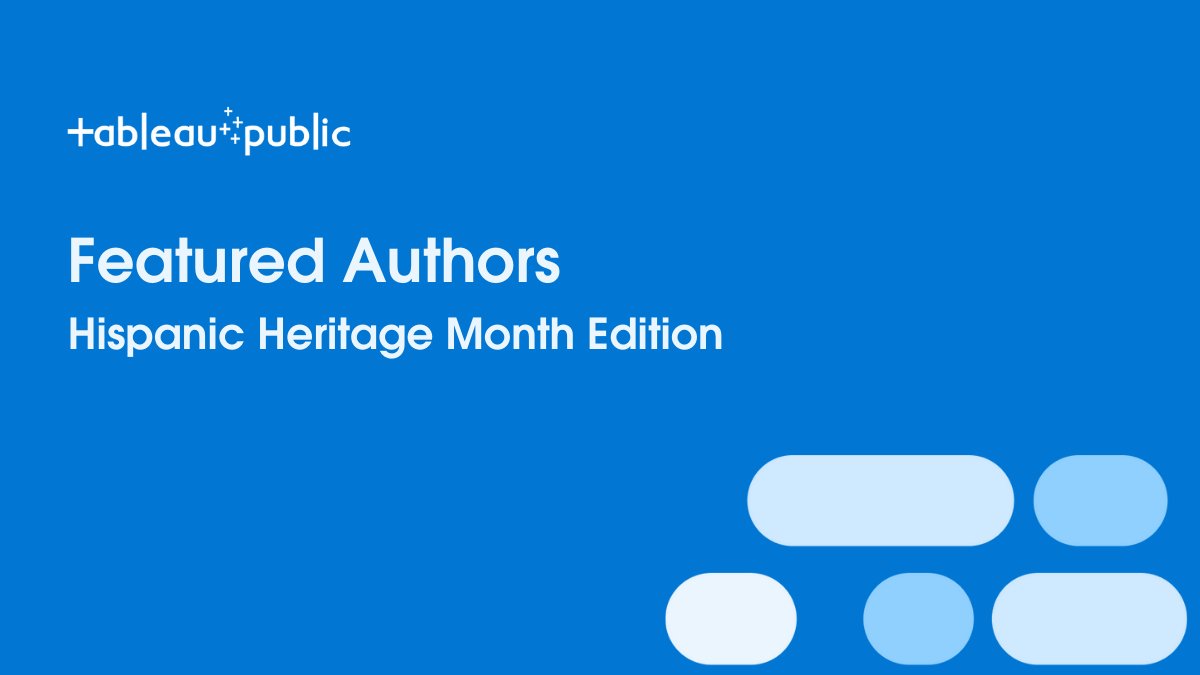
The new Featured Authors cohort is here 🎉. In celebration of Hispanic Heritage Month explore the outstanding work and profiles of these authors with latin roots. https://t.co/bQxEdINX6f
#datafam, do you know this cool trick to make your dashboards more engaging? ❄️🌷☀️🍁
This mobile @tableaupublic dashboard gives monthly suggestions and changes with the season! See for yourself: https://t.co/SSPZU9jGZK
Thread below 👇 (1/5)
Using #ChatGPT I created text's for each month that uses a highlight for that month. Such as Christmas in December and Valentine's day in February. ❄️💕 (4/5)
🚨🚨 New viz alert
I just created a new dashboard on mapping in Tableau. 🌍 Dive into 3 map-making methods and discover their pros/cons with me.
#datafam, you can use this to determine what data to use for your next mapping project. Explore here: https://t.co/1BuNIoRgfw
Congratulations to the 2023 Tableau Public Ambassadors!
Tableau Public Ambassadors design beautiful vizzes, telling stories through data while inspiring others. They support our programs and have created unique community projects to help others grow their own skills.