Evil rarely announces itself.
Hannah Arendt didn’t warn us that the greatest danger would come from monsters.
She warned us it would come from ordinary people who stop asking questions. People who trade conscience for slogans, curiosity for certainty, and morality for obedience.
The lesson of the Holocaust was never just about one man. It was about what happens when a society decides that thinking is optional.
Every generation believes it would have stood against evil.
History keeps asking the same question:
Would you have?
Or would you have simply gone along because everyone else did?
That’s why Arendt still matters. And that’s why this conversation matters. Because the opposite of evil isn’t outrage.
It’s the courage to think for yourself.
See the world not as you wish it to be, but as it truly is.
Only when you strip away the illusions, the noise, and the distractions will you truly see. Only then will you have the chance to adapt, to rise above, and to take control of your path. By embracing reality, no matter how uncomfortable, you’ll sidestep the traps set by those who manipulate and distort the truth to keep you blind, trapped, and powerless.
Keep your vision clear. Refuse to be a pawn in someone else’s game. The world doesn’t wait for dreamers. It rewards those who dare to wake up.
@mr_abundance_ This relly hit home. Especially "my life was a reflection of my limited consciousness". Have been thinking about this for an hour. This is a fire post 🙏 Thank you sir
“Mate, how can you understand capital rotation? Do you have any tips or framework to follow?"
Ok guys, let’s break down one of the most important (and most ignored) concepts in trading in 4 steps. (❗️Another share of brutal value below❗️)
Disclaimer: this is not about predicting markets.
It’s about understanding how money may move.
(Yes, long post again. Same rules, only for those who want to learn and grow, the rest will skip it as always)
🔸 1st step -> What capital rotation actually is (risk on/off)
Markets are not random as capital is constantly moving between asset classes:
• Equities/crypto (risk)
• Bonds (safety)
• Currencies (liquidity)
• Commodities (inflation)
Big money is always reallocating.
So instead of asking: “Is this bullish or bearish?" I ask myself: “Where is capital flowing right now?”
Because that’s what drives trends.
Markets, as you know, operate in 2 main regimes:
• Risk-on → capital seeks returns
• Risk-off → capital seeks protection
🔍General "clues":
Risk-on:
- Equities trending higher
- Weak USD
- Strong crypto / growth
- Cyclicals outperform defensives
- Small caps outperform large caps
- Bond prices down / yields up
- Liquidity expanding (QE for example)
- Real yields falling
Risk-off:
- Strong USD
- Bonds bid
- Equities weak
- Gold rising
- Liquidity tightening (QT)
- Real yields rising
If you misread this → you’re fighting the environment.
This becomes the primary requirement in order to build a macro thesis and elaborating on specific sectors.
🔸 2nd step -> Intermarket analysis
When I built up an investment thesis I go for IMA as markets tend to confirm each other..nothing moves in isolation.
As we saw before, we have a "general outlook", right?
• Rising yields → pressure on equities
• Strong dollar → risk assets struggle
• Bond rallies → defensive positioning
When markets align → higher probability
When they diverge → lower conviction
This is how you can build context.
However, intermarket can and must be extended within specific sectors to gauge their relative strength/weakness in order to have a broader perspective.
How to?
With the use of synthetic indexes: https://t.co/8i7troUv8O
⭕️Example:
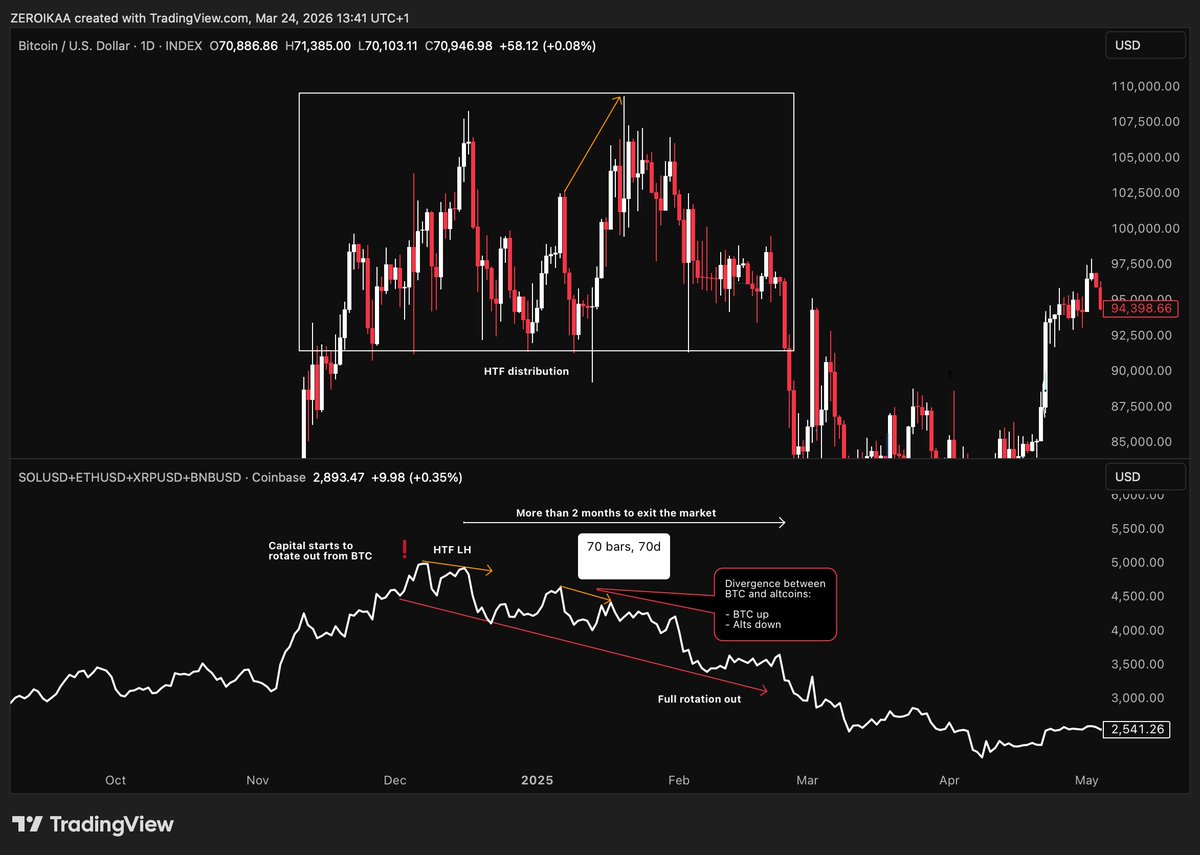
In the chart you find out at the bottom, I compared $BTC and a synthetic index made with: SOLUSD + XRPUSD + ETHUSD + BNBUSD.
Why those altcoins? Because they're the "top caps", very well capitalized, and act as reference to understand where capital is rotating.
The distributive range developed on $BTC between late November 2024/late February 2024, even to an "untrained" eye, could have been spotted through the use IMA by observing the behavior of the synthetic index.
In fact, when $BTC was distributing, the index was producing the first HTF LH, signaling a rotation out from the crypto market..why?
Because more speculative assets (and less liquid) experience stronger inflows or outflows and tend to anticipate $BTC movements.
--------------------------------------------------------
Core "extras" to complete this part:
🟡 IMA explanation -> https://t.co/6V9m7XxvBK
🟡 Video explanation -> https://t.co/H3XYoyfufC
🔸 3rd step -> COT
Now we start adding the positioning of those who matter.
COT (released every week) answers:
“How is capital positioned within this flow?”
Not the direction (this is something you have to figure it out on your own with intuition + PA) but positioning.
It shows:
• Who is long
• Who is short
• Where trades are crowded
COT splits the market into:
• Commercials (hedgers)
• Non-commercials (speculators)
• Retail
⭕️The key idea is that speculators follow trends while commercials tend to fade extremes.
So now you can combine flow (IMA) + positioning (COT) and that’s where things get interesting.
⭕️Example:
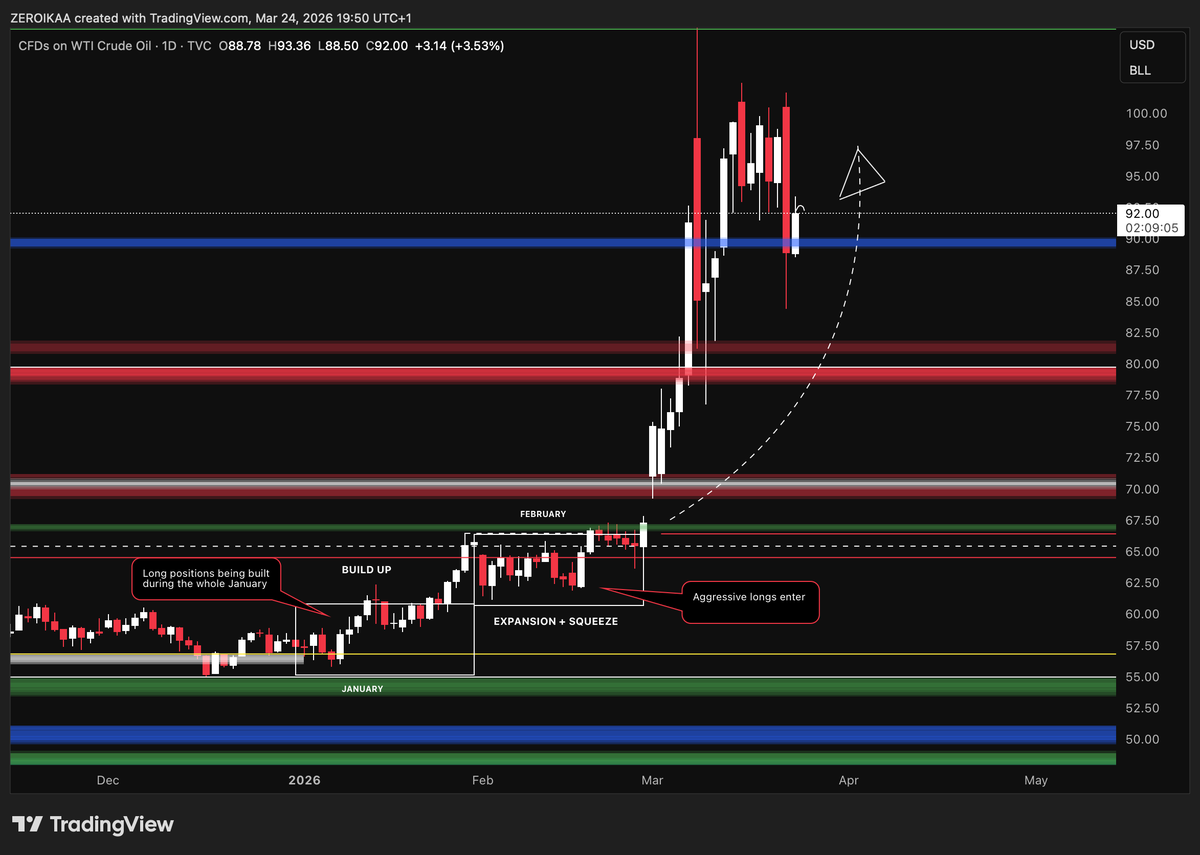
Take a look at the USOIL chart where the bias, due to liquidity dynamics, price action and fundamentals -> https://t.co/0zU2kLPSuz was bullish.
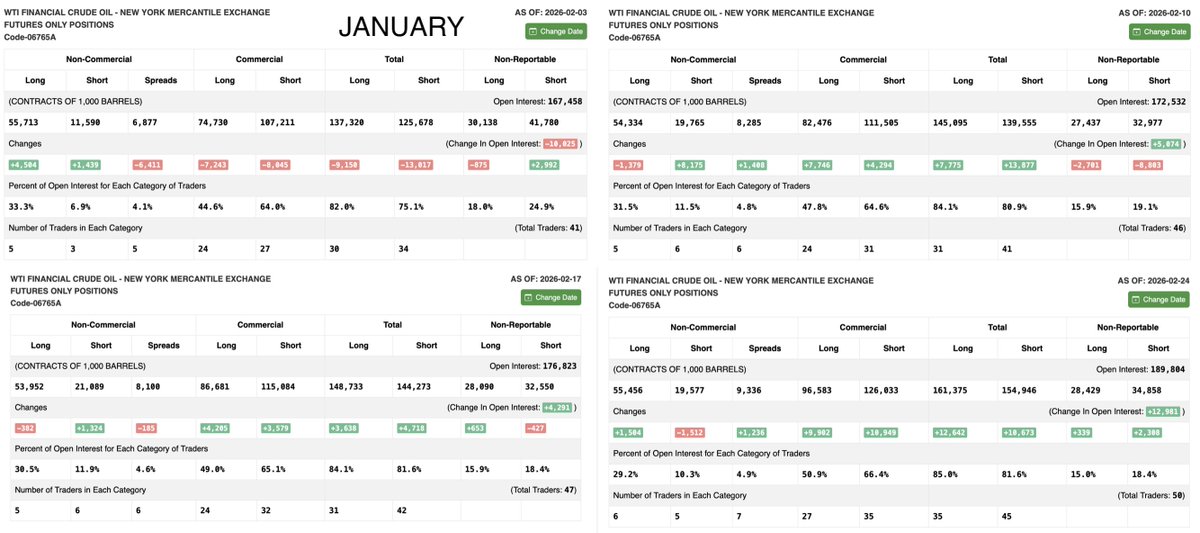
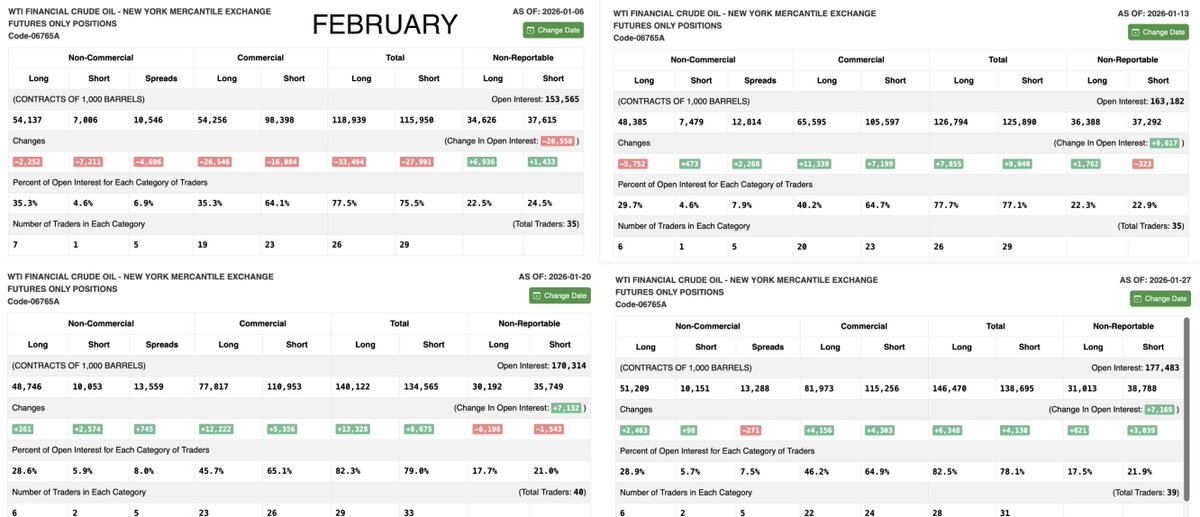
Now put your eyes on the 2 rectangles where you read "build up" + "expansion/squeeze" having a look into the COT reports of the whole January + February.
On January 6, we saw a massive drop in Open Interest which was a clear liquidity reset that wiped out positioning.
Then on January 13 and 20, OI started to expand again with broad participation, and this is key as the market was building positioning, but not moving yet. (check longs being added)
Moving into February, on February 3 we got a brief pullback, but then something important changed.
From February 10 onward, the market started to add longs, while shorts were still stepping in.
By February 17, positioning was stretched, and on February 24, OI expanded sharply with longs pushing and shorts getting forced out, triggering the breakout.
When longs keep building for a lot of time and shorts keep fading the move, you create fuel and pressure ⛽️ in the same system.
In this way, you could have be positioned together with institutions.
❗️Important note:
As the COT report is being released every week, you need to constantly keep track of the positioning, elaborating a thesis with the delta provided step by step.
🔸 4th step -> How to use it + execution
This is NOT an entry system.
You use it to:
- Build bias
- Stay positioned
- Avoid potential bad trades
- Identify stretched markets
Then you refine with:
- Your entry models
- Price action
- Liquidity
- Structure
That’s your execution layer, you don't long/short just based on COT/IMA.
👉We can summarize my process in this way:
- Understanding capital flow/building thesis (risk on-risk off)
- Confirming with intermarket
- Checking positioning (COT)
- Finding the setup based on entry models and AMT -> https://t.co/D9GLAYjotw
- Executing
If everything aligns → I engage with more confidence
If not → I wait a little bit more/stay cautious
I believe that most people just watch candles but very few watch flows and how to be aligned with smart money.
As always, if you found this helpful, the like and repost buttons are just a few centimeters below.
The Most Important Realization for a Technical Trader is this
If you get this one truth, your entire trading career changes overnight: Technical analysis doesn’t predict the market, it frames your behavior within it.
Most traders spend years trying to use charts to forecast the future. They draw levels, patterns, fibs, and divergences thinking they’ll “know” what comes next.
But the market isn’t a puzzle to be solved, it’s a dynamic auction that constantly reprices information.
The true power of technical analysis is not prediction, it’s context. It helps you define:
Where your thesis is valid or invalid.
Where risk and opportunity are asymmetrical.
Where others are trapped and where you can act objectively.
Once you realize this, your charts stop being prophecy tools and become decision frameworks.
Your trades stop being about being right and start being about executing your edge
The shift looks like this…
From “What will happen?” to “What will I do if it happens?”
From “I think price will go up.” to “If this level reclaims, I’ll look for confirmation and risk 1R.”
From prediction to probability.
The moment a trader stops using charts to predict and starts using them to prepare, is the moment they cross from amateur to professional.
Cracked the code...
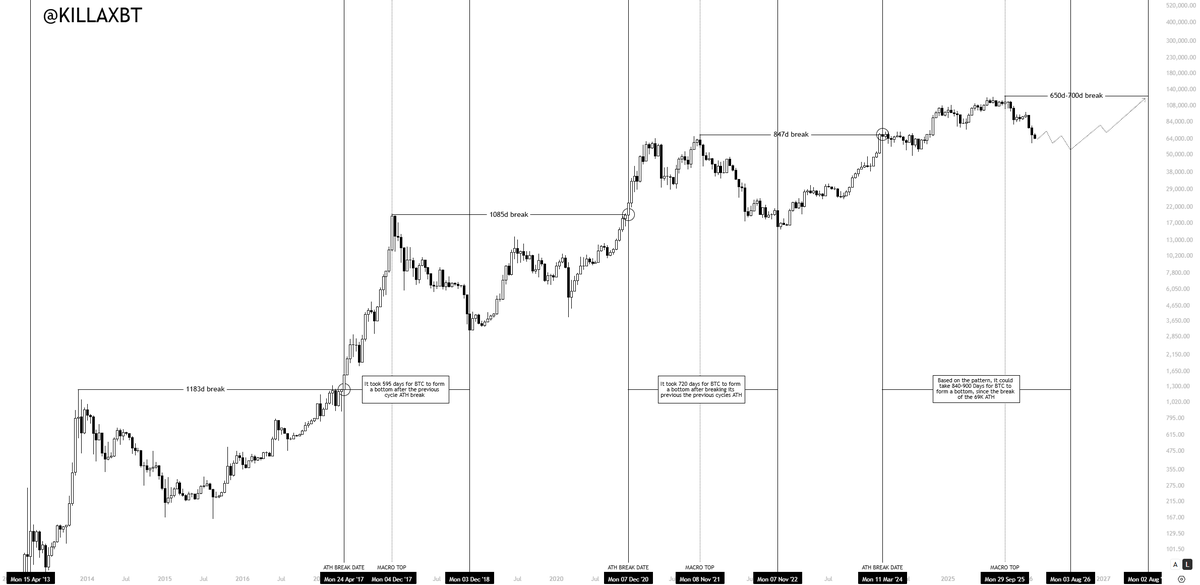
Why we bottom sooner than most expect.
We created a ATH pre-halving, that changed everything.
595D. 720D. The pattern points towards 840-900D.
Which means BTC bottoms in July/August.
Buying $BTC now is equivalent to buying 22K last cycle.
Thread: The Liquidity Pivot No One Is Ready For
A Major Macro Reversal Is Setting Up, and Smart Money Is Already Positioned
For months, markets have been pricing fear, uncertainty, and liquidity stress.
But beneath the surface, the largest capital allocators on the planet are quietly repositioning.
And they are all positioning for the same outcome:
Bond rally → yields collapse → liquidity return → risk-on explosion → crypto ignites
Let's break down the evidence. 🧵👇
Price action tends to gravitate towards the most significant liquidity centers, and that's exactly why we've seen the dump that we have seen in the last couple months. There's no doubt that the most significant liquidity still lies lower, however we have taken enough liquidity for a lower high bounce/corrective rally IMO
My opinion is that we see a corrective bounce and a lower high, followed by the real bottom in Dec/Jan, then we see a strong bullish market from 🇨🇳 to 🛳
Then the second half of 2026 will be horrifically bearish, to the point that we will be back to a similar situation as at the end of the 2021/2022 bear market. Crypto is dead will be the narrative, Bitcoin will be below $50k, and most other coins will be turning to dust
This is my plan and read on the market at the macro level. Now it comes down to executing on the micro level. And ofc, things change and things fluctuate each week and each month. But currently these are my thoughts and read based on the charts