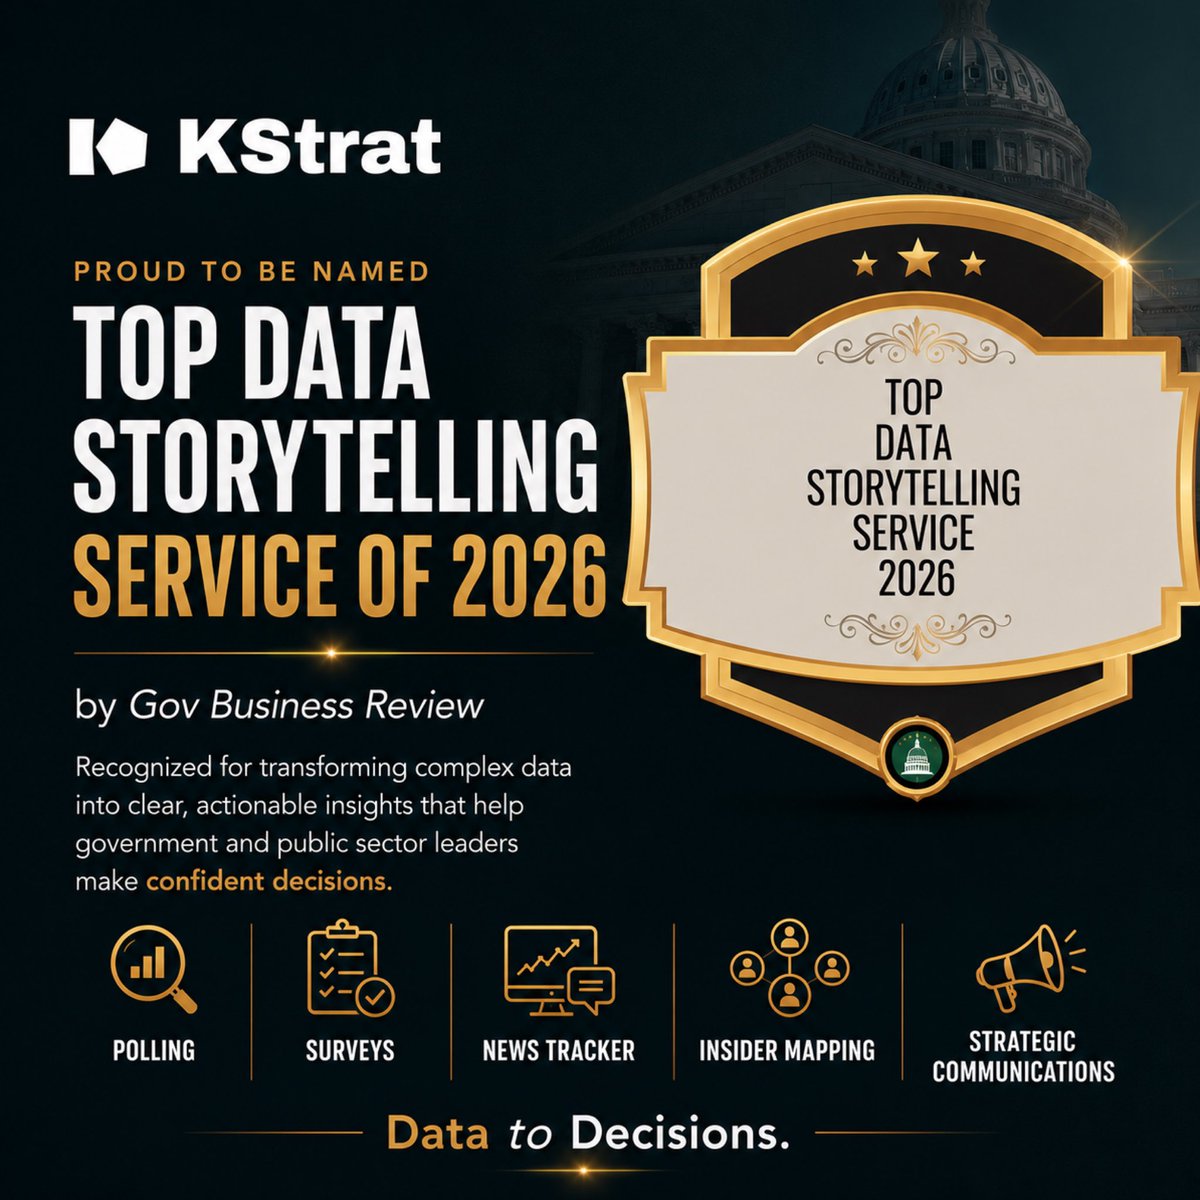
Big news! KStrat has been recognized by Gov Business Review as the Top Data Storytelling Service of 2026!!! 🏆
We’re honored to be recognized for helping organizations transform complex data into clear, actionable decisions.
This is just the beginning 🙌
#KStrat#Data
Your campaign runs.
Support jumps 12 points.
Success?
Maybe.
A similar city without the campaign also gained 6 points.
Difference-in-Differences estimates the additional impact at 6 points, assuming comparable underlying trends.
Change ≠ Causation.
#Data
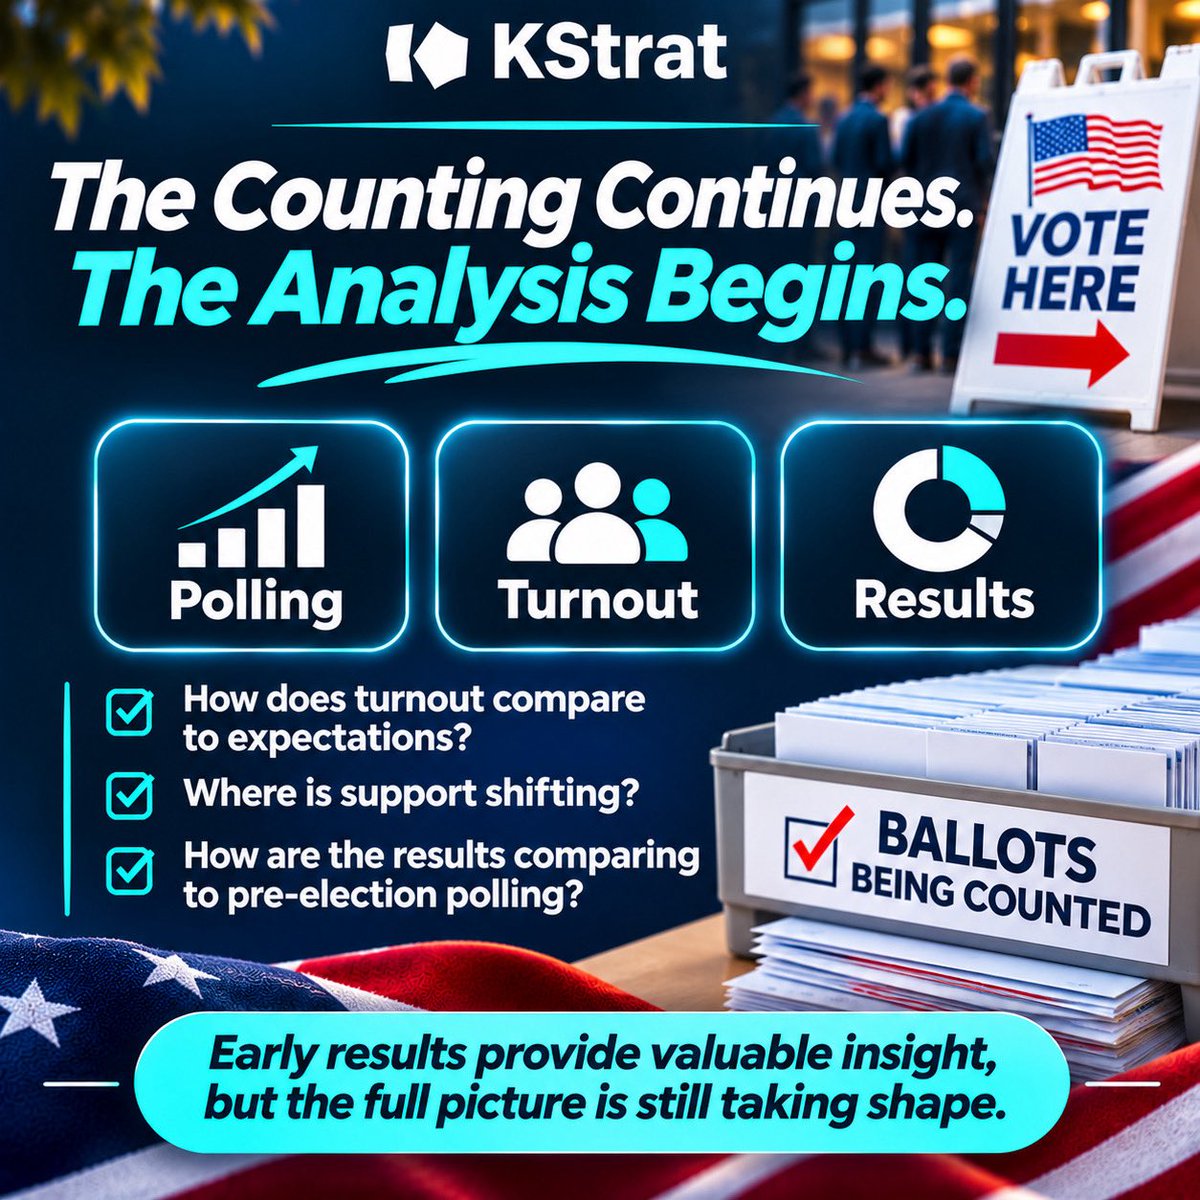
The polls are closed. The counting continues.l 🗳️
Who’s turning out? Where is support shifting? How are results comparing to the polls?
Early numbers tell part of the story.
The analysis helps us understand the rest.
#Polling
We’ve studied the polls. We’ve analyzed the trends. We’ve followed the numbers.
But today, the voters have the final say.
The polls measured. The voters decide.
Happy Election Day!
#Election#Vote#General
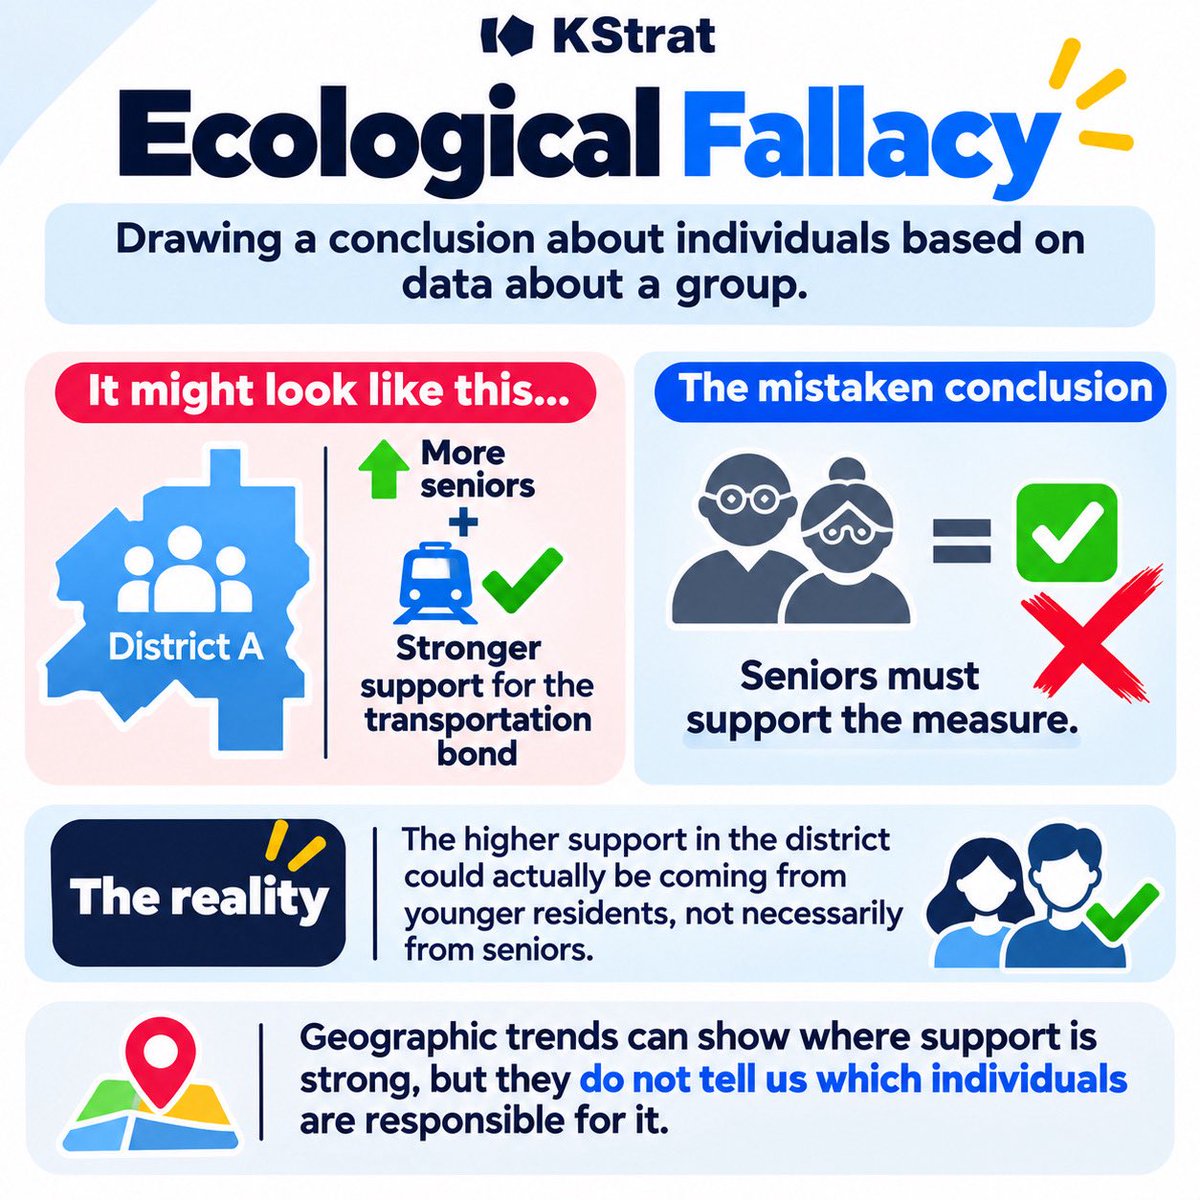
A district has more seniors.
That district also strongly supports a transportation bond.
Does that mean seniors support it?
Not necessarily.
That’s the Ecological Fallacy.
Knowing WHERE support is strong doesn’t automatically tell you WHO supports it.
#polling#survey
You analyze 30 voter groups. One shows a dramatic shift. Breakthrough? Not necessarily.
The more comparisons you make, the more likely you are to find something unusual by chance.
That’s the Multiple Comparisons Problem.
One standout result needs context.
#polling#survey
Approval rating: 45% normally.
One poll: 38%. Next poll: 43%.
A comeback? Not necessarily.
Regression to the mean means unusually high or low results often move closer to average in later measurements.
Not every #polling swing reflects changing #opinions
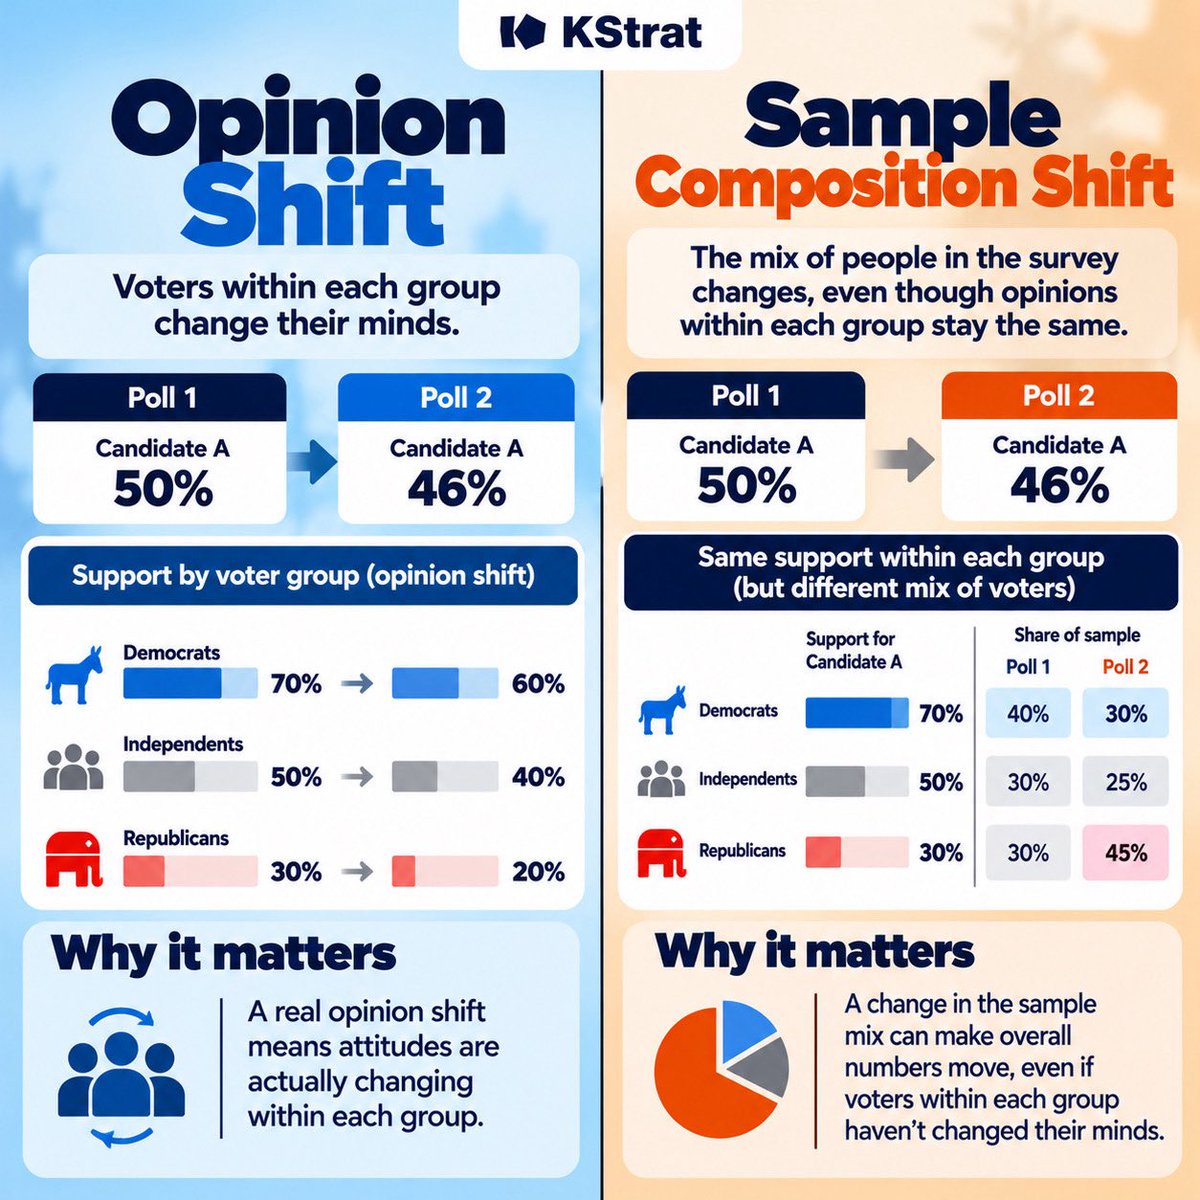
Candidate A drops from 50% to 46%.
Did voters change their minds?
Maybe. Maybe not.
🤔Opinion Shift = Preferences changed.
📋Sample Composition Shift = The mix of respondents changed.
A moving poll number doesn’t always mean moving voters.
#Polling
Random Sampling ≠ Random Assignment.
Sampling: WHO gets selected for a poll.
Assignment: WHAT message each participant sees.
One supports broader population insights.
The other helps test cause and effect.
Same word. Different science.
#Polling#Data
“Do you have children?”
“No.”
“How would you rate your child’s school?”
👉See the problem?
Skip logic prevents irrelevant follow-up questions.
Better survey design means fewer unnecessary questions and more meaningful answers.
#Survey#Research#polling
Leading in the polls ≠ Guaranteed to win.
💥 Poll Snapshot = Where voters stand today.
💥 Election Forecast = What might happen on Election Day.
One measures preferences. The other estimates outcomes.
Neither guarantees the result
A 10-point increase or a 25% increase? Believe it or not, they can mean the exact same thing. 🤯
If support goes from 40% to 50%:
👉10 percentage points gained
👉25% relative increase
Same numbers. Different headlines.
And that’s why understanding how data is presented matters
A 25-point lead sounds massive.
Until you learn the group represents only 14% of likely voters.
👉Subgroup Lead = Margin within a group.
👉Electorate Impact = Contribution to the overall result.
Big percentages need context.
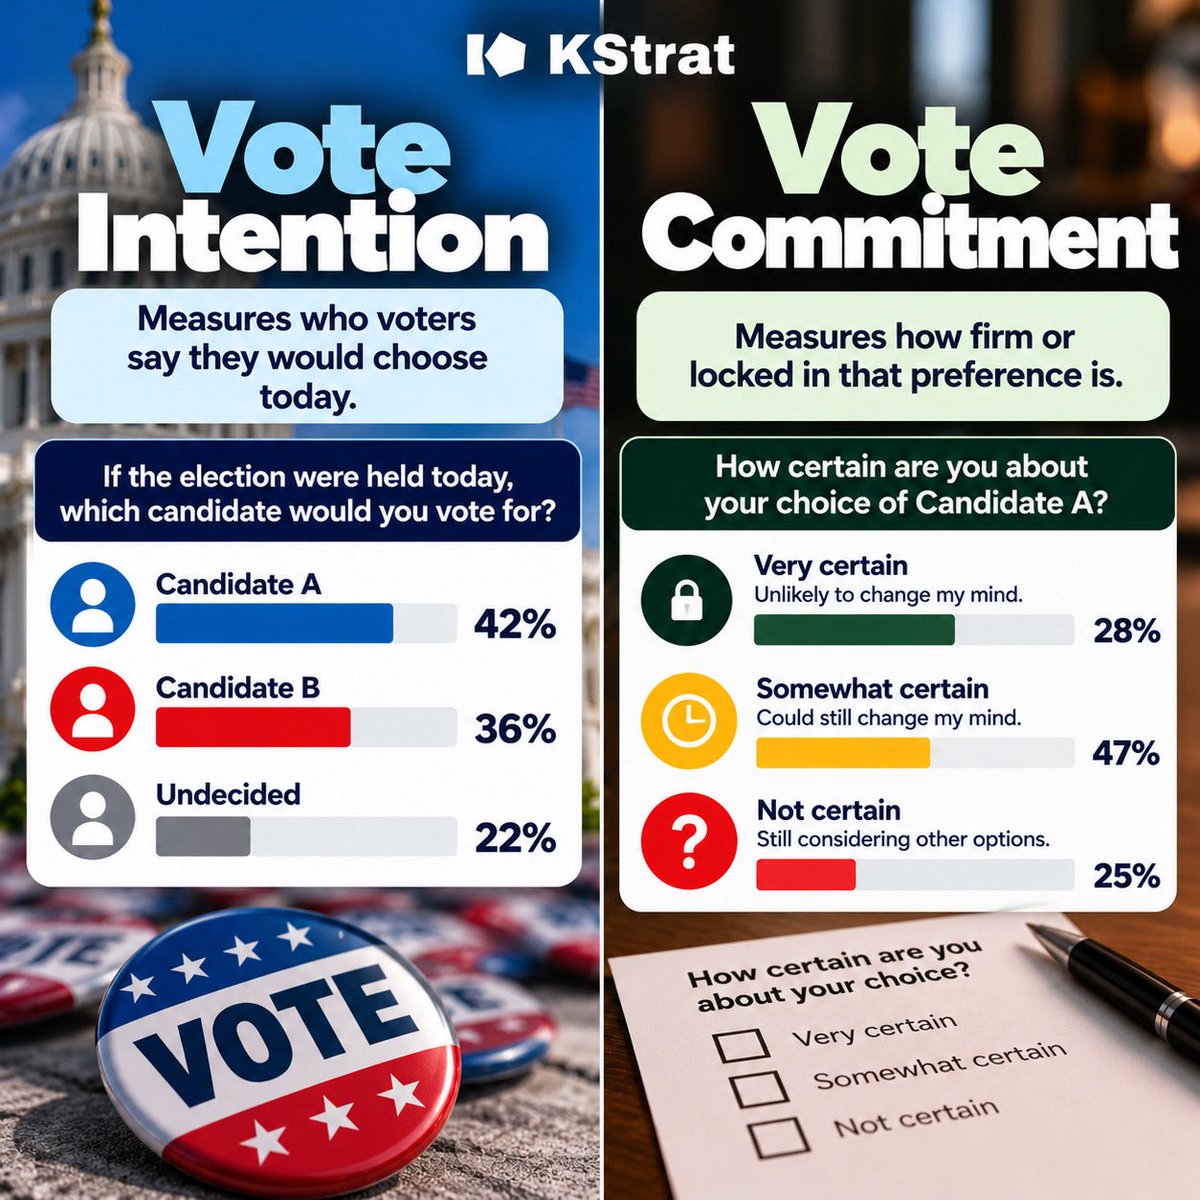
A voter choosing Candidate A today doesn’t mean they’ll stick with Candidate A.
🗳️ Vote Intention = Who they’d vote for.
🗳️ Vote Commitment = How certain they are.
Same candidate. Different levels of confidence.
#polling#survey#election
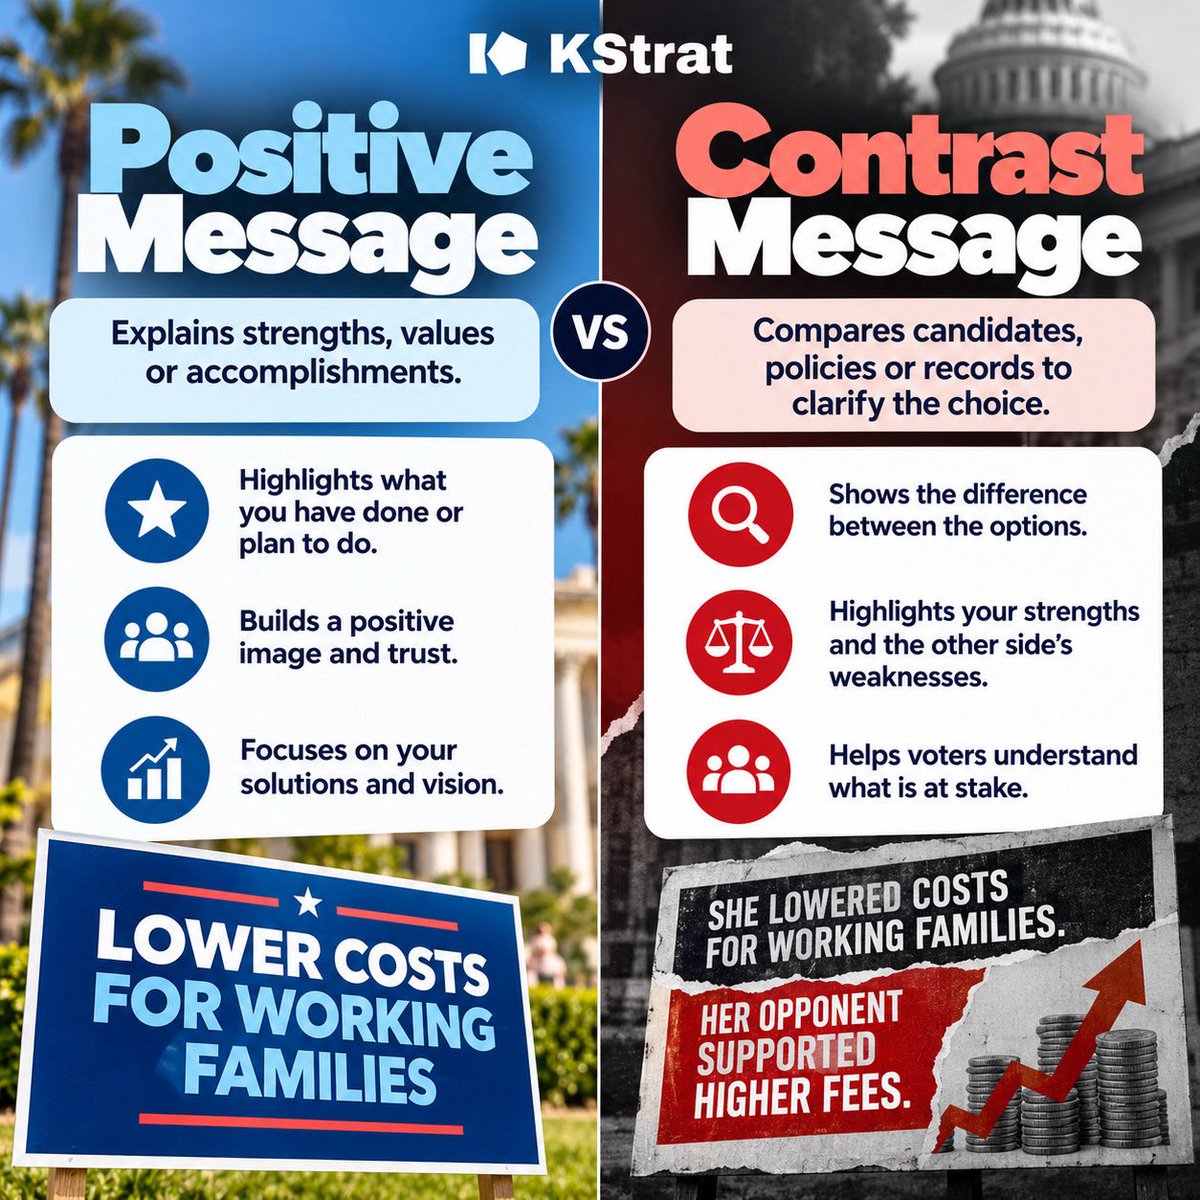
“Here’s what I accomplished.”
vs.
“Here’s how our records differ.”
📪Positive messaging tells one story.
📪Contrast messaging compares two.
Same political issue. Different communication approach.
#PoliticalMessaging#Polling
Voters can agree on what’s important and disagree on who’s best equipped to address it.
Issue Priority = What voters care about.
Issue Ownership = Who voters trust to handle it.
Same issue. Two different insights.
#KStrat#Polling
Undecided voters aren’t always completely undecided.
Some already lean toward a candidate.
👉Leaner Question = Ask voters directly.
👉Undecided Allocation = Estimate where they’ll go.
One measures a stated preference. The other models a possible outcome.
#KStrat#Polling
Support was 50% last month.
It’s 50% today.
Nothing changed? Not necessarily.
Voters could be moving in opposite directions, canceling each other out.
The topline shows the result. The underlying patterns help explain the movement.
#KStrat#Polling
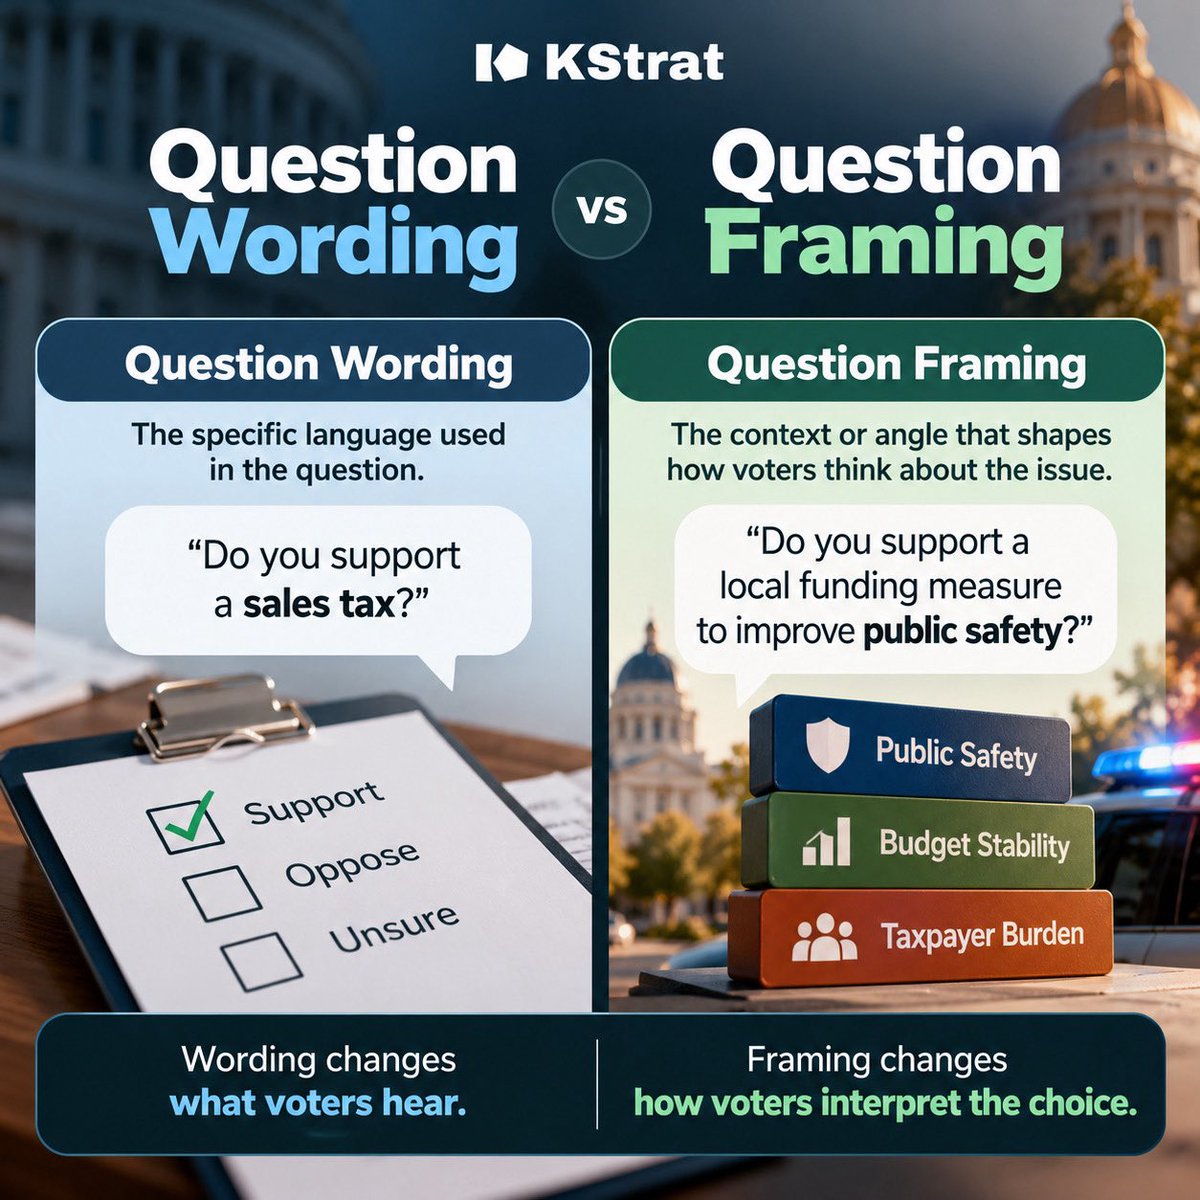
Same issue. Different question. Different response.
Wording changes what voters hear.
Framing changes how voters interpret the choice.
Good polling isn’t about getting the answer you want. It’s about understanding what voters actually think.
#KStrat#Polling
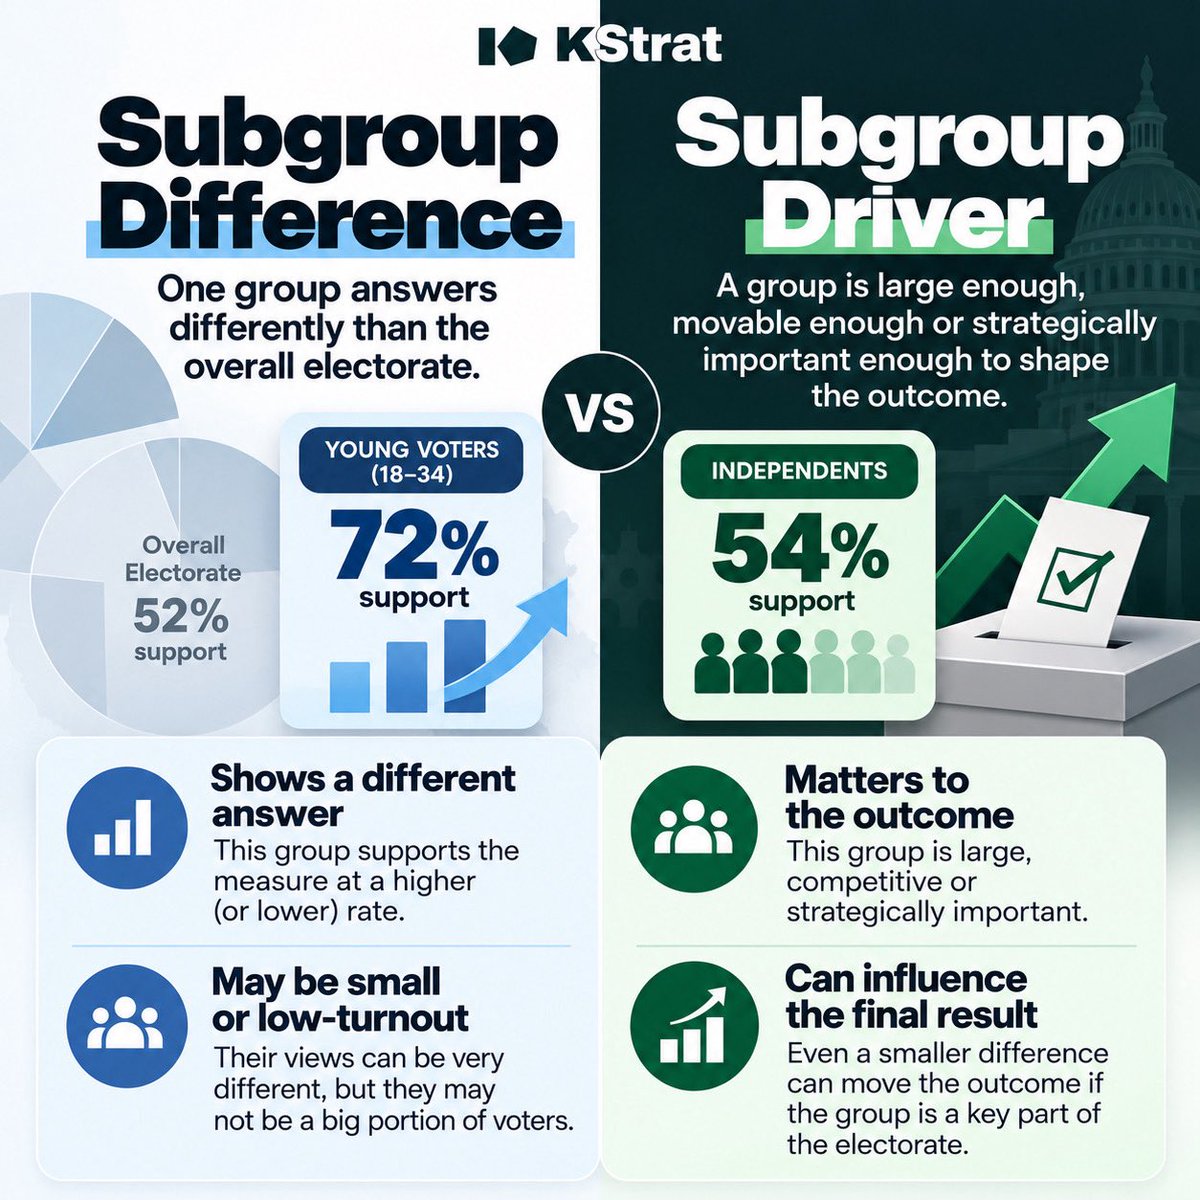
A big polling difference doesn’t always mean a big impact.
💥 Subgroup Difference = Who thinks differently.
💥 Subgroup Driver = Who can influence the outcome.
The loudest number isn’t always the one that matters most.
That’s why we look beyond the toplines at KStrat.
49% vs. 47% doesn't automatically mean someone is winning.
A statistical tie means the poll can't confidently identify a leader.
An actual tie means both candidates have the exact same percentage.
Understanding the difference matters.
#polling#survey