bitcoin:native On track for its 3rd best August ever and its first green August in 4 years.
September is historically a slow and pretty bad month followed by Q4 which is historically very good.
But we are in a really interesting situation here as opinions are very divided on the bear market bottom being in or not.
The 4 year cycle as we know it broke in terms of price, not in time last year. (Top was in line, but the year was red in 2025).
So there is a case to be made for this bear market to be shorter and less severe. Especially considering every other market has skyrocketed this year.
I am still in the camp that I just try to be nimble. My approach was to accumulate near the Weekly 200MA, which has historically been good value. Those buys are sitting comfy now. But with this bounce I would not want to see price go down there again anytime soon. If it does, that'd just signal a lot of weakness.
DCA in good value, DCA out when things get crazy. Regardless of timing, macro or whatever is going on, this has always proven well in the long run. Important is to invest with an investment horizon of years, not months or weeks. When it comes down to bitcoin:native that is.
$BTC Big level here on the day.
Lots of confluence with a lot of levels that would determine where the momentum is headed in the short to mid term.
🔸.382 Fib Retracement level from August move
🔸4H 200MA & EMA
🔸Monthly VWAP
🔸Highest volume area from past weeks
🔸Weekly 200MA at $64K as well
So good area to watch today. Below $64K and I think the bears will take control of this week's price action.
Most interesting is still to play alts that are more unbothered by BTC the past few weeks. Definitely some decent runs while BTC has been chopping around.
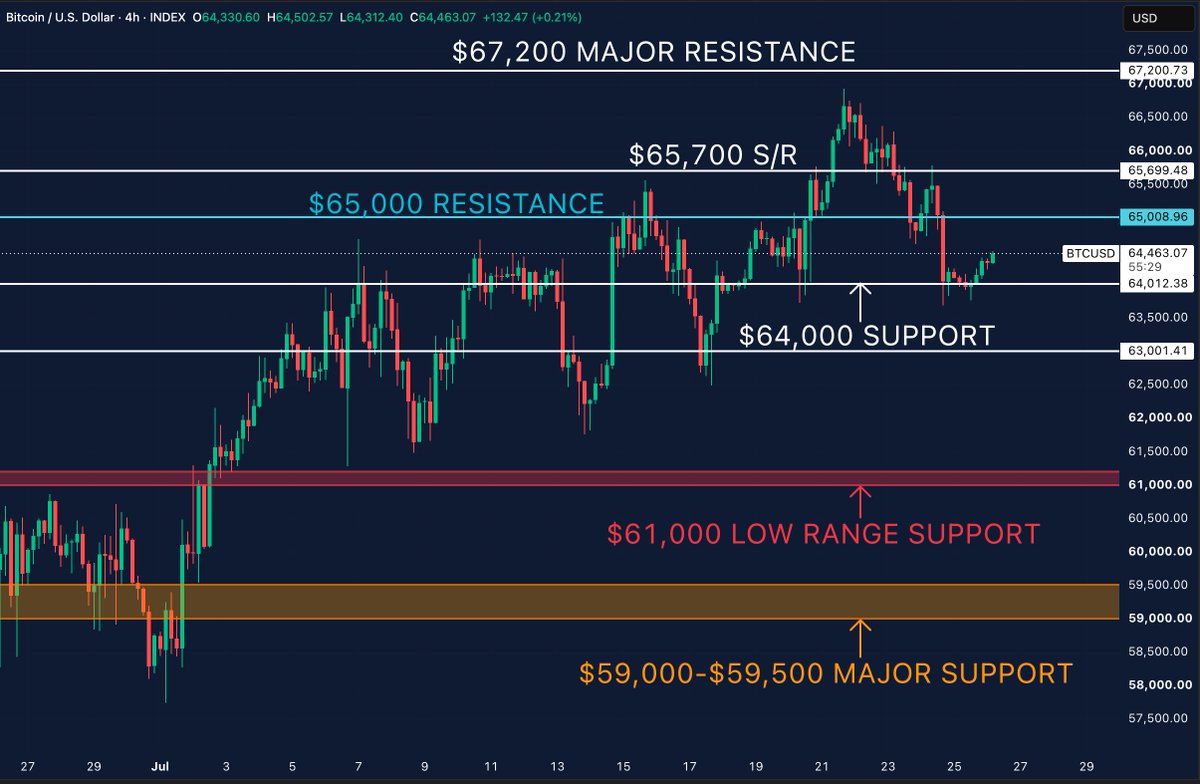
Bitcoin is sitting right on one of the most important levels on the chart.
$64,000 has held once again.
If bulls can defend it here, I think we see another push into $65,000, and a reclaim there opens the door for $65,700.
Lose $64,000, and I think we head back towards $63,000 instead.
This is the level I'm watching today.
$BTC
Everything went exactly as planned
We crashed back to 64 000$
Now expecting at least a small bounce from this level.
If the bounce is too weak, this means bears have won.
Let's see.
#Bitcoin
Weekly Chart TA
my 1st TA from Damascus :)
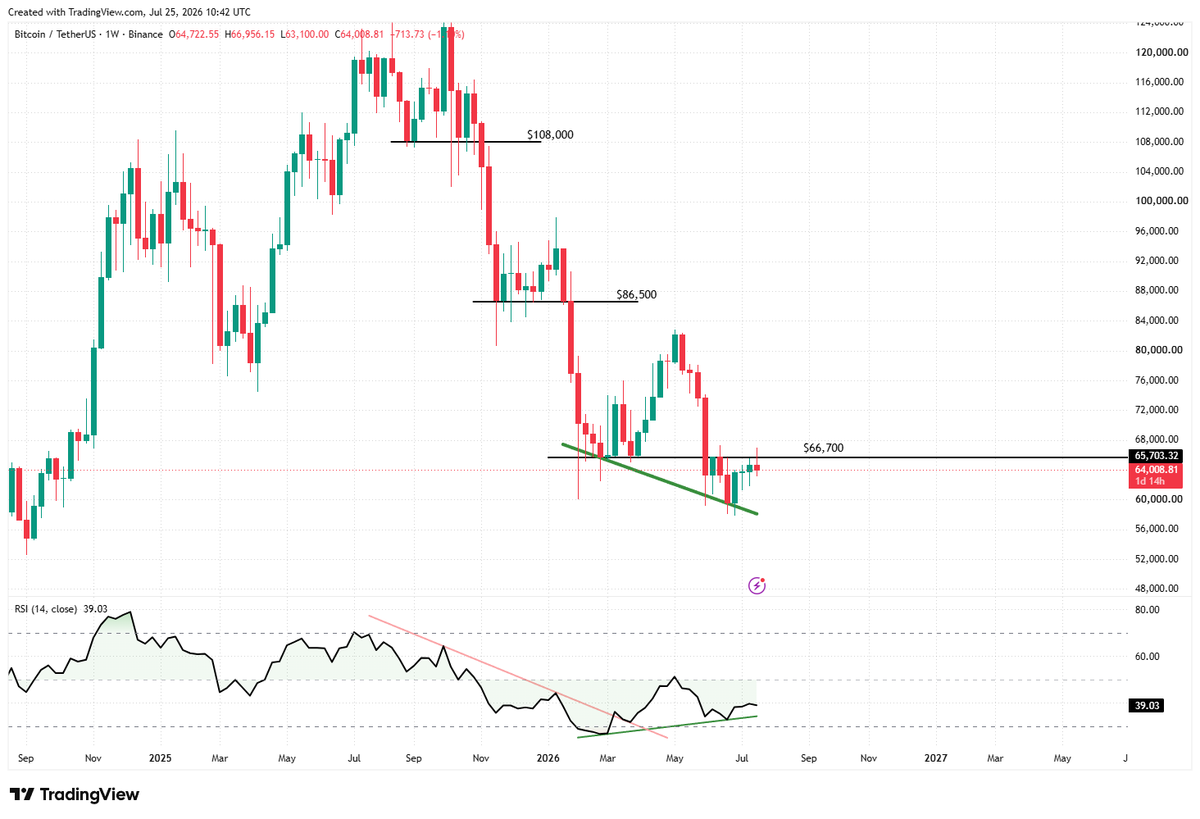
weekly $BTC is showing clear and decent #bullish divergence for the 1st time since 2022 cycle bottom
this can be a very constructive start to form a real cycle bottom.
$66,700 is the key
to confirm bottom formation from here, we want to see no new lows & two clean weekly closes above $66,700
When Full Reversal?
two weekly closes above 82.3k (higher high) can confirm full reversal
#trading
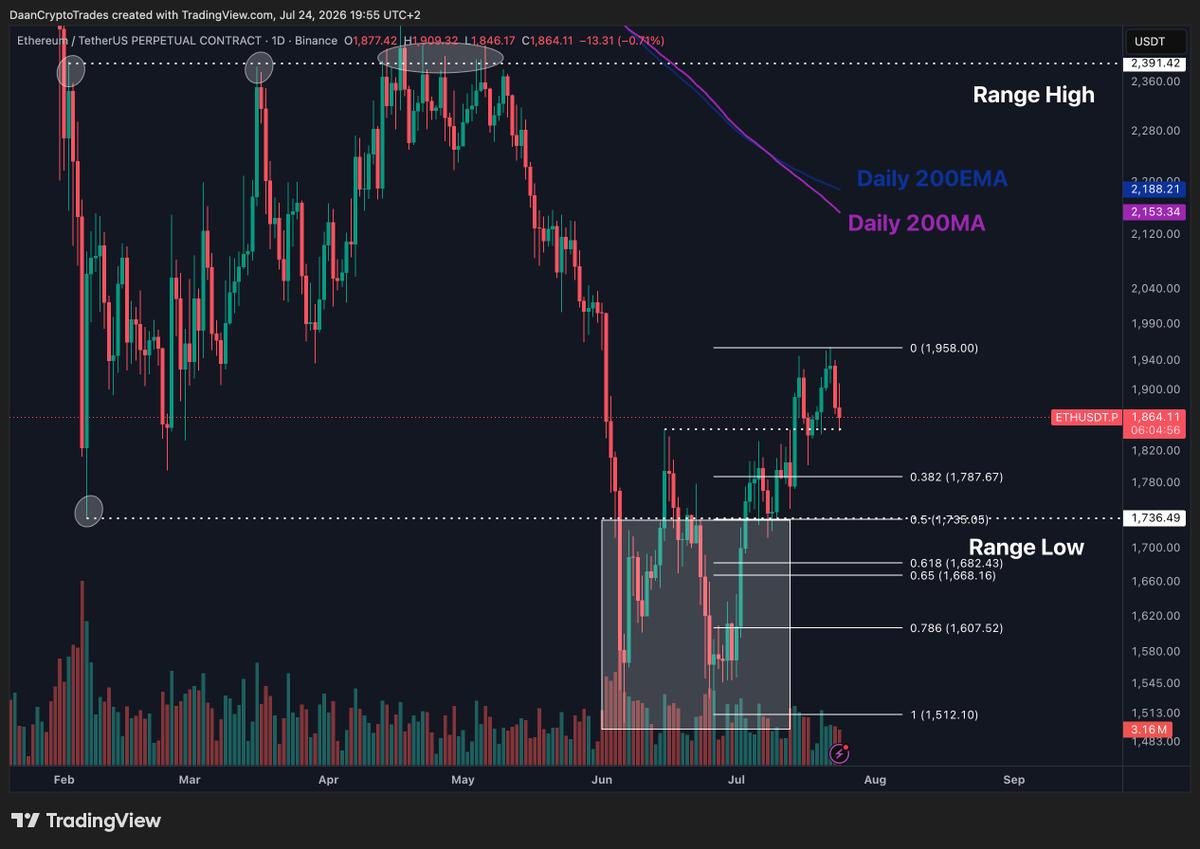
$ETH Still looks pretty okay. It's a very choppy grind up but we are still seeing higher highs and higher lows locally.
If price can break back above ~$1950 (local highs) I think that would push this quite a bit higher at that point and test ~$2150 and ~$2350 after.
Important local level here around $1850 to hold now.
$BTC A lot of things going on within this price range:
🔸 .618 Fibonacci Retracement at $58K
🔸 Weekly 200MA at $63K
🔸 Weekly 200EMA at $69K
🔸 Bull Market Support Band at $70K
🔸 Big Horizontal Support/Resistance level at ~$73K
Bitcoin is currently only holding slightly above the Weekly 200MA (Purple).
The bulls would want to see a push above all these other levels to really confirm a larger macro bottom is in for Bitcoin in my opinion. So keep an eye out for that happening and the weekly candle closes around each of these levels.
Price is getting more compressed the longer it trades at this area so a larger move will occur at some point.