Silver remains technically vulnerable below the 50-day moving average.
🔻 Below $74.93:
→ opens the way for $72.53
→ then $69.31
→ and possibly $67.93
🟢 Bulls need a close above $79.75:
→ to signal the decline is failing
→ opening the way for $81.80 and potentially $84.38
Bottom line: Silver’s broader technical structure still leans bearish while prices remain below the 50-day moving average, but the market is nearing levels where either downside acceleration or a meaningful corrective rebound could develop quickly.
Read the full daily update:
https://t.co/lRaO5vUBqG
Our weekly Metals Commentary and daily updates cover:
• COMEX precious metals
• Spot gold & silver
• Gold/silver ratio
• Metals ETFs
• LME base metals
#Silver #PreciousMetals #Commodities $SI
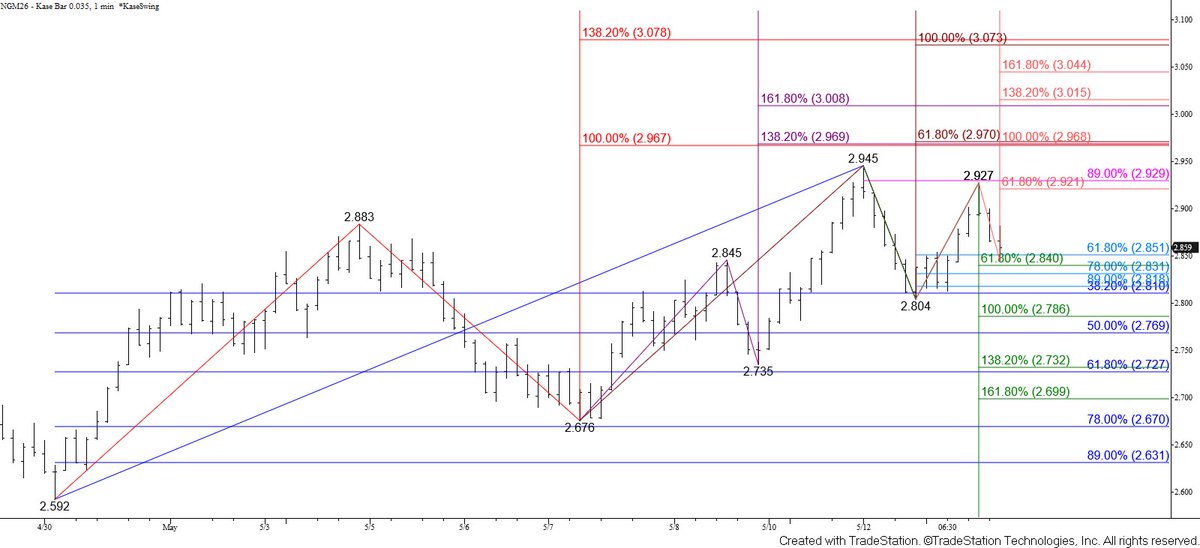
The natural gas correction may be complete...
Today’s pullback confirmed a bearish momentum divergence and formed an intraday head-and-shoulders pattern.
🔻 Below $2.98:
→ confirms the head and shoulders
→ targets $2.93
→ then $2.87 and possibly $2.83 (target of the head and shoulders)
🟢 Bulls regain control above $3.16:
→ Rising above $3.08 calls for another attempt at $3.16
→ Settling above $3.16 calls for $3.20 and $3.24
The broader trend is still technically bullish — but near-term downside risk is rising quickly.
Read the full daily update:
https://t.co/4A47rHMRab
Get our full Natural Gas Commentary + daily updates free for 4 weeks:
https://t.co/MN2okfIWhJ
#NaturalGas #EnergyMarkets #Commodities $NG
Diesel is struggling to overcome resistance at $4.18.
That level has held for a week and could form a significant triple top.
🟢 Above $4.18:
→ $4.237
→ then new contract highs
→ $4.317 and possibly $4.424
🔻 Below $3.942:
→ opens the way for $3.866
A close below $3.866 would confirm the triple top and shift the outlook toward:
→ $3.748
→ possibly $3.564
Trend indicators remain neutral, so the next breakout or breakdown could be decisive.
Read the full daily update:
https://t.co/Gjjgaa9noP
Get our full weekly crude oil forecasts + daily updates free for 4 weeks:
https://t.co/MN2okfIWhJ
#Diesel #EnergyMarkets #Commodities $HO
Natural gas is testing a support zone.
Today’s pullback challenged near-term support at $2.84 after prices failed to sustain momentum near $2.93.
🟢 Above $2.89:
→ $2.92
→ then the highly confluent $2.97 target
🔻 Below $2.84:
→ $2.81
→ $2.78
→ then key support at $2.73
The broader structure still favors higher prices — but downside risk is growing after today’s weak bounce.
Read the full daily update:
https://t.co/5D1RzRJkLv
Get our full Natural Gas Commentary + daily updates free for 4 weeks:
https://t.co/MN2okfIWhJ
#NaturalGas #EnergyMarkets #Commodities $NG
Brent crude keeps climbing — but $107.9 may be a decision point.
🟢 Above $107.9:
→ $110.7
→ $112.5
→ $115.7
🔻 Below $101.0: Odds increase for a deeper pullback toward $96.5
Trend structure still favors higher prices, but daily trend indicators are neutral, and consolidation risk is still present.
Read the full daily update: https://t.co/Ler1u8dTxN
Get our full weekly crude oil forecasts + daily updates free for 4 weeks: https://t.co/MN2okfIWhJ
#BrentCrude #CrudeOil #Commodities $BZ
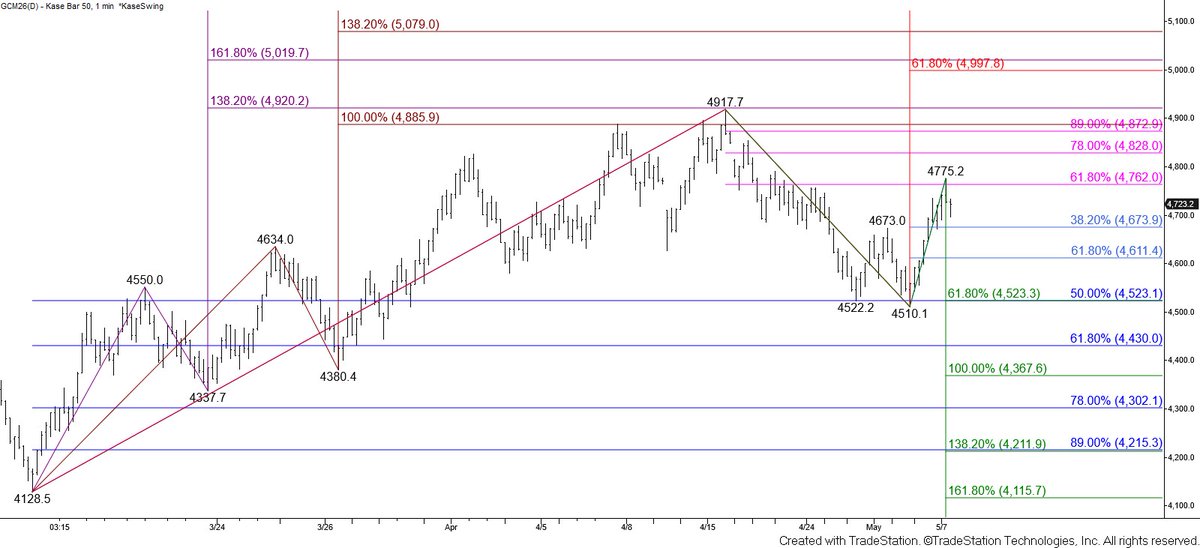
Gold’s bullish Harami was confirmed yesterday… but today’s follow-through was weak.
That makes this a very tight technical setup.
🟢 Above $4762:
→ $4816
→ then $4889
🔻 Below $4523:
→ $4430
→ likely $4368
For now, bulls still have the edge while $4523 holds, but this is a tight call ahead of the weekend.
Read the full daily update:
https://t.co/JTVONHvF2O
Get our full Metals Commentary + daily updates free for 4 weeks:
https://t.co/MN2okfIWhJ
Natural Gas remains bearish 👇
Break of $2.746 invalidates prior bullish wave from $2.592.
Now it’s all about $2.69:
🔻 Close < $2.69 → $2.66 → $2.58
🔻 Opens door below $2.62 (major confluence)
🟢 Only way bulls regain control:
Close > $2.81 → $2.87 → $2.98
Get the full analysis
👉 Free 4-week trial: https://t.co/MN2okfIWhJ
📩 DM “NATGAS”
WTI Crude Oil: Market at a Decision Point
WTI is consolidating within Monday’s range—typically a signal that traders are waiting for the next catalyst. The broader uptrend remains intact. However, confirmed daily bearish divergences (KaseCD, MACD, RSI) suggest the market may need a deeper correction before making another push higher.
Key technical levels for tomorrow:
· $100.2 → Breakdown opens downside toward $95.3
· $103.5 → First signal of renewed strength
· $105.3 → Momentum acceleration level
· $108.3 → Breakout → targets $111.1 and higher
This is a tight range with asymmetric risk—exactly the type of environment where timing and levels matter most.
We track this daily with:
· Short-term tactical updates
· Weekly multi-market energy forecasts (WTI, Brent, products, spreads)
· Structured scenarios—not just opinions
If you want to see how we map these moves before they happen, we’re offering a complimentary 4-week trial at https://t.co/MN2okfIWhJ
#WTI #CrudeOil #TechnicalAnalysis #Trading
WTI Crude Oil Price Forecast – February 3, 2026
March WTI crude oil initially fell to challenge the 38 percent retracement of the rise from $54.84 at $62.0 and the $61.5 larger than (1.618) target of the wave down from $66.48 again. Both levels held on a closing basis for the second straight day, and the rise from $61.12 is poised to reach its $64.3 smaller than (0.618) target. This is also the 62 percent retracement of the decline from $66.48. Settling above $64.3 will imply that the corrective pullback from $66.48 is complete and call for a push to challenge the $65.2 equal to (1.00) target of this wave and the 78 percent retracement. Rising to $65.2 will also fill Monday's breakaway gap down from $65.21. Settling above $65.2 will call for another test of $66.1, an important target that held on a closing basis last week. Settling above $66.1 will clear the way for $66.9 and higher, putting March WTI back on a path to eventually challenge the $69.8 confirmation point of a double bottom that formed between the $54.56 and $54.84 swing lows.
Monday's midpoint held on a closing basis, and the daily bearish KaseCD divergence and Stochastic overbought signals that were confirmed within the past few days warn that a deeper test of support might still occur. Taking out the $62.6 corrective swing low of the wave up from $61.12 will invalidate this wave and the connection it makes from $64.2 to $65.2 and higher. This will also call for another test of $62.0 and possibly key near-term support at $61.5. Settling below $61.5 will put the near-term odds in favor of March WTI falling to challenge $60.6 and lower.
This is a brief analysis for the next day or so. Our weekly Crude Oil Forecast is a much more detailed and thorough energy price forecasts that cover WTI, Brent, RBOB Gasoline, Diesel, and spreads. Daily updates are included. If you are interested in learning more, please sign up for a complimentary four-week trial at https://t.co/MN2okfIWhJ
#WTI #CrudeOil #TechnicalAnalysis #Trading
It was an absolute honor to speak with James Brodie, C.M.T. (@jamesrbrodie) about the markets and market psychology on Flux Markets first episode of Train to Trade.
It is absolutely worth watching, because James and his colleagues cover a lot of great information.
Thank you to James and everyone at Flux Markets for the opportunity. I look forward to joining them again soon.
The Truth About Trading: How Pros Read Markets Before Everyone Else https://t.co/ZRiNuQm0hY via @YouTube
LME copper’s formation of a double top around $13400, and today’s confirmation of daily bearish momentum divergence and overbought signals, indicate that a deeper correction will probably occur before the uptrend extends. The intraday wave formation down from $13407 also makes a connection to the double top’s $12517 confirmation point. However, this is a tight call for the next couple of days because the late move up from $12915 calls for a test of $13200 and possibly another attempt to settle above $13400.
Read our short-term outlook at https://t.co/Km2tqPbtCE
#Copper #TechnicalAnalysis #Trading
Brent crude oil has turned decisively bullish, breaking above the $64.81 swing high and settling above key Fibonacci projection levels and the 100- and 200-day moving averages. Prices are now trading above all major moving averages, daily trend indicators are bullish, and a double bottom around $58.4 strengthens the bullish case. A sustained close above $66.1 will call for $66.9 and likely $68.0. Key near-term support is $64.1, with a deeper correction to $63.1 and possibly lower in the case that $64.1 fails to hold.
Read our short-term outlook at https://t.co/rgqYODdViP
#BrentCrude #Oil #Trading #TechnicalAnalysis
February gold’s pullback from $4584 appears to have completed a corrective phase, with key Fibonacci support levels holding. Gold is now positioned to retest $4500, with a close above that level opening the door to $4532, $4563, and potentially a new high near $4615. Near-term support sits at $4426, with deeper downside levels at $4394, $4362, and $4327. A close below $4327 would shift the bias back to the downside, targeting $4259 and $4212.
Read our short-term outlook at https://t.co/7YzTqHlRnQ
#Gold #TechnicalAnalysis #Trading
February natural gas rose today, confirming daily bullish momentum divergences on the KasePO, RSI, Stochastic, and MACD oscillators. This signals downside exhaustion and sets up a broader test of resistance before the downtrend resumes. Price has respected the $3.59 level so far. Closing above this will clear the way for $3.67, and potentially $3.77 and $3.83. However, failing to close above $3.59 and taking out $3.43 would refocus attention on critical near-term support at $3.30.
Read our short-term outlook at https://t.co/J5yWgNjI76
#NaturalGas #TechnicalAnalysis #Trading
WTI crude oil tested and held key resistance at $58.8 before pulling back, reinforcing this level as a near-term ceiling with multiple technical factors aligned there. A close below the 20-day moving average points to a likely test of $56.3 support. Closing below this would suggest the recent corrective bounce from $54.89 is complete, opening the way for a continued decline. Should $56.3 hold and price recover above $58.2, another test of $58.8 is likely. A sustained close above $58.8 would call for $59.9 and $60.3.
Read our short-term outlook at https://t.co/Tfjpqw42TE
#WTI #CrudeOil #TechnicalAnalysis #Trading
January natural gas briefly dipped below the trendline up from $3.913 but held key support at $4.51. The near-term outlook remains bearish with no confirmed bullish reversal signals. Closing below $4.51 would indicate the advance from $3.913 has ended and open the way for a test of $4.38, a move below which would provide the final piece of evidence to confirm the uptrend has been broken. However, today’s spinning top suggests market indecision, and this area could serve as a stalling point. A rebound above $4.69 would target $4.78 and potentially $4.86. Settling above $4.86 would signal improving bullish sentiment and revive the possibility that the uptrend can extend.
Read our short-term outlook at https://t.co/j6nmERcQuL
#NaturalGas #TechnicalAnalysis #Trading
WTI crude oil failed to retest the $60.0 resistance area and instead formed a bearish engulfing line, signaling weakness within the descending broadening wedge that has developed since the $61.84 high. With a shortfall suggesting the wedge may fail, January WTI is now poised to test $58.3 and likely $57.7, with a close below $57.7 opening the way toward a key downside target at $56.6. While a rebound toward $60.0 remains possible, only a sustained close above $60.4–$60.7 would confirm a bullish breakout.
Read our short-term outlook at https://t.co/QApRgMpphf
#WTI #CrudeOil #TechnicalAnalysis #Trading