Der 100-Jahre-Plan für den Aktienmarkt
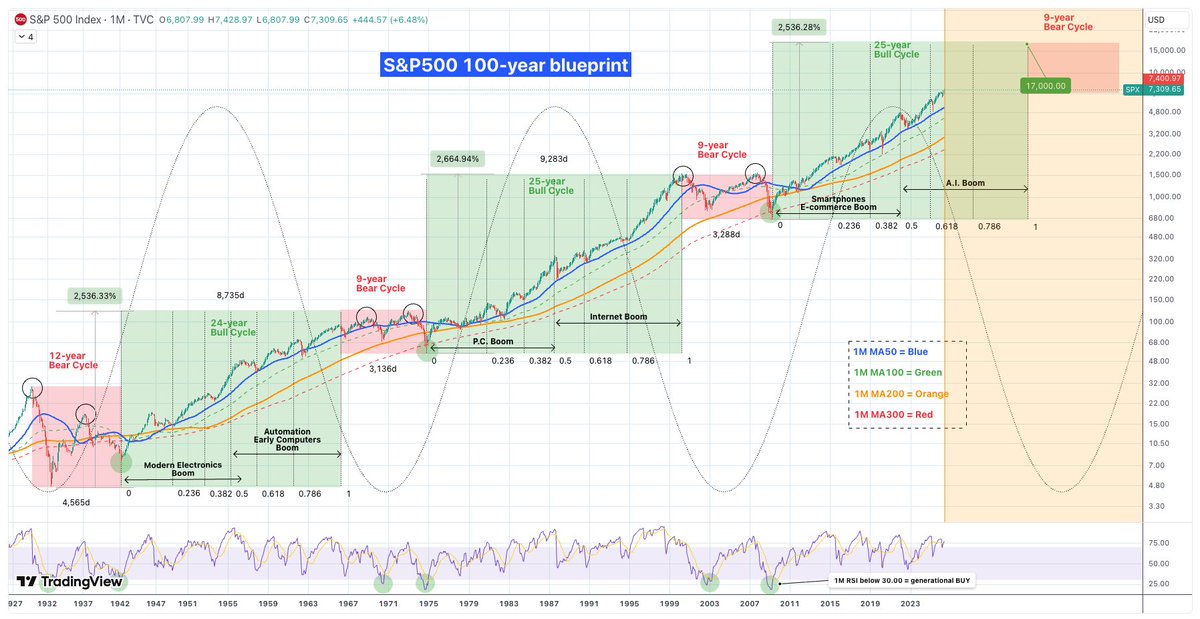
Wenn du dir die letzten 100 Jahre anschaust, siehst du ein klares Muster: Der Markt wiederholt immer wieder die gleichen Zyklen. Seit der Großen Depression 1930 gab es drei große Abwärtsphasen und drei Aufwärtsphasen .
Wir stecken gerade mitten im dritten großen Bullenmarkt.
Die schlechten Zeiten (Bärenmärkte)
Diese Phasen dauerten meistens etwa 9 Jahre (die Weltwirtschaftskrise von 1930 war mit 12 Jahren eine Ausnahme). Ein typisches Zeichen war, dass der Markt zweimal oben und zweimal unten „anklopfte“, bevor es wieder aufwärts ging. Oft krachte der Kurs bis zu einer bestimmten langfristigen Linie (dem 300er-Schnitt im Monatschart) und startete von dort aus neu durch.
Die guten Zeiten (Bullenmärkte)
Die ersten beiden großen Aufwärtsphasen dauerten jeweils 24 und 25 Jahre. Das Spannende: Sobald der Markt einmal Fahrt aufgenommen hatte, fiel er fast nie unter eine bestimmte grüne Linie (den 100er-Schnitt). Die blaue Linie (50er-Schnitt) war dabei immer die beste Chance, um günstig nachzukaufen, wenn es mal zwischendurch ruckelte.
Warum steigt der Markt so extrem?
Hinter jedem Bullenmarkt steckt eine neue Technologie:
Früher waren es industrielle Durchbrüche.
Dann kam der Internet-Boom.
Heute erleben wir den E-Commerce- und Social-Media-Boom.
Klar, irgendwann platzen diese Blasen immer, weil die Leute übertreiben. Aber die Technik bleibt! Das Internet ist nicht verschwunden, nur weil die Kurse im Jahr 2000 abgestürzt sind – es wurde zum Fundament für alles, was wir heute nutzen.
Der KI-Boom
Wir sind jetzt im zweiten Teil des aktuellen Aufschwungs, und der wird von der Künstlichen Intelligenz getrieben. Wahrscheinlich wird diese Blase um das Jahr 2034 platzen. Das wird wehtun, aber danach wird KI das feste Rückgrat unserer gesamten Wirtschaft sein.
Im Grunde sind die letzten 100 Jahre eine Kette von Erfindungen, die die Kurse immer höher treiben. Die Abstürze zwischendurch sind nur dazu da, die heiße Luft rauszulassen und Platz für neues Geld und die nächste Technologie zu machen.
Was bedeutet das für dich heute?
Wenn dieser Zyklus so läuft wie die letzten beiden, könnte der S&P 500 bis auf 17.000 Punkte steigen.
Es wird zwischendurch immer wieder Korrekturen geben. Der Zoll-Crash Anfang 2025 war so ein Moment, hat aber die wichtige blaue Linie nicht ganz berührt.
Schau auf den RSI-Anzeiger. Wenn der unter 30 fällt, ist das eine Chance des Jahrzehnts. Das ist in 100 Jahren erst sechsmal passiert – und jedes Mal war es der perfekte Zeitpunkt zum Kaufen.
Liken, Folgen, Speichern, Kommentieren, Teilen.
Danke für den Support 🫶😊🫶
In 2021 I called the top at $68,000
In 2021 I called for 18k at $68,000
At 18k I called for 100-120k in 2022
In 2025 I called for the top at 120k
At 120k I called for the target of 60k
Say something my friends..
$BTC (Video)
Monthly timeframe breakdown.
I’m laying out what you should be focused on right now - and trust me, almost nobody is explaining this correctly.
If this triggers you, that’s fine. If it helps you, like & repost so it reaches the right people.
GOLD
Monetary hedges lining up with late liquidity cycle dynamics.
A story of easy money...
If you want to see more videos like these on gold smash that like & repost button!
Scientists tracked 25,315 women for 25 years.
Those who followed one eating pattern had 23% lower risk of dying from anything.
Not a fad. Not restriction. A 4,000-year-old diet backed by the largest nutrition trial ever run.
Here's exactly what I'd eat (and avoid): 🧵
New Bitcoin 4 Year Cycle video has been published to Youtube. With new action in the model portfolio.
The Turn in the Cycle https://t.co/UXIAgM2btO
Appreciate a share and retweet.
When the RECESSION comes:
‘End of Q1 2026’
Everyone will panic
My followers and I won’t,
I will teach you.
How to BUY the #crypto Market Bottom:
It’s not even a secret.
It’s simple.
But most big whales don’t want you to know this.
They want you scared.
Panicked.
Shaken out.
If you haven’t heard of it,
The tool?
The Bitcoin Rainbow Chart.
It’s simple.
This chart helps you identify when #Bitcoin is absurdly undervalued or overheated.
And it’s worked PERFECTLY every cycle.
Look at the chart below.
Every time $BTC enters the blue “Fire Sale!” zone,
it has marked a macro bottom.
Every. Single. Cycle.
FIRE SALE = BUY.
Now here’s the REAL secret:
When Bitcoin breaks out of the lower bands and creeps into the green “Accumulate” zone,
that is usually the end of the bottom and the beginning of the expansion phase.
Why?
Because this shows the market has shifted from fear → recovery.
And smart money enters BEFORE retail wakes up.
ACCUMULATE = THE REVERSAL IS HERE.
Like this tweet and I’ll share more practical knowledge.
That’s it,
I don’t want anything from you.
Just want my followers to win.
I will be ready to buy the next generational bottom.
Follow me so you don’t miss it.
$BTC (VIDEO)
Complete breakdown on where Bitcoin stands right now - key levels, trend shifts, and what’s next 🔥
I also show you how to carve out 95% of these uptrends once we find our setup
If you enjoy these vids, drop a ❤️, and repost for me 🙏
$BTC (VIDEO)
May still have another leg up this year… but right now, the charts are clear in the short & mid-term
(and yes, I’m short again 👀).
Watch the video to see why.
Please a like and re-post to let me know these videos are still worth doing for everyone 🫡
🚀 $BTC (VIDEO)
I cut through the noise and share the next 2 incoming setups on Monthly & Weekly
The hopium you been needing. Members are already preparing for the breakout Arrow. Imagine catching the next leg using Alpha Stops 📈💰
Like + Repost if you value real alpha 🧠🔥
This isn’t the end of Bitcoin. It’s not even the beginning of the end. It’s the end of the beginning.
Worth a read if you want to know why Bitcoins price action is doing what it's doing...
Just created my $1M crypto strategy using data-backed methods that beat following influencers & gambling on tokens.
This transformed how my 100+ students approach crypto investing.
For 24 hours, it's yours for FREE.
Like, RT & Comment "CRYPTO" and I'll DM you a copy.
$BTC (Video)
I am still in my short position. This is the chart I shared with subs this morning. You can see the head and shoulders I called before it broke and the double top (white drawings)
If you want to learn how to read the charts I post this is a good video to watch.