A method that's mainstream among pro traders:
FVG (Fair Value Gap).
You only need 3 candles.
Bullish FVG: a gap between candle 1's high and candle 3's low
Bearish FVG: a gap between candle 1's low and candle 3's high
It can show where big players may reload orders.
$XAUUSD
For short swings, that's a take-profit level.
For long swings, you may have just bought into a downtrend.
Beginners make this mistake a lot. Always check the higher timeframe. $XAUUSD
This one matters.
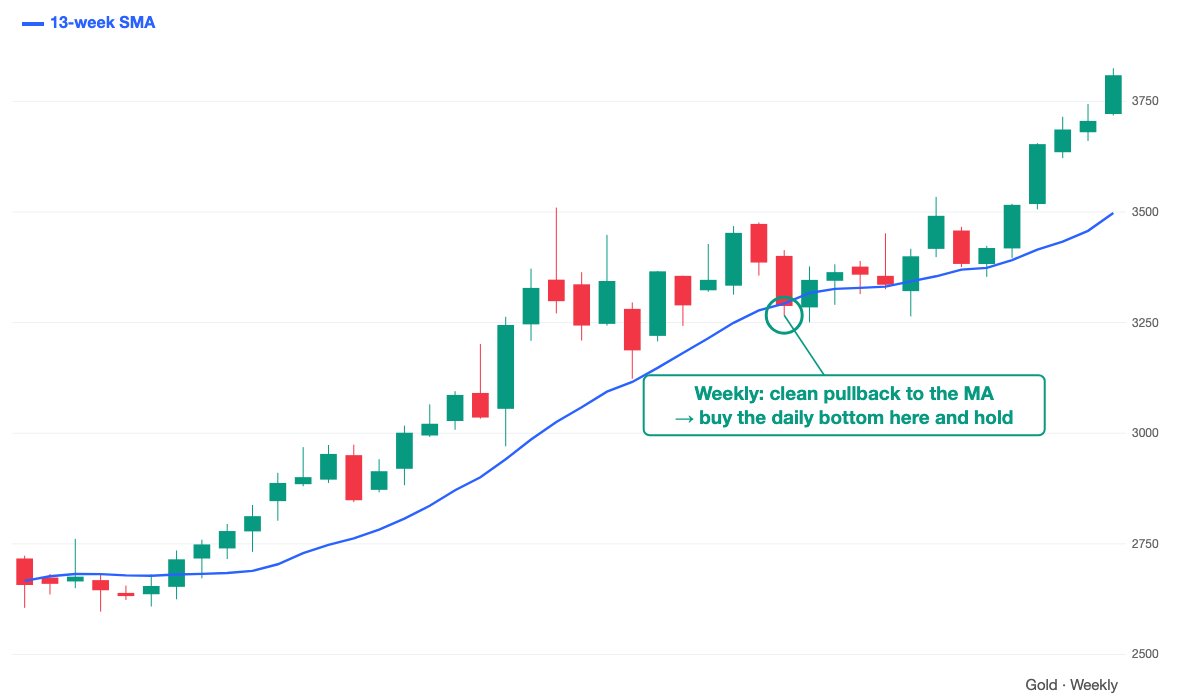
On the daily: golden cross + perfect order. Looks unstoppable.
But on the weekly it's still a downtrend, just converging. So a rejection at the long MAs is more likely.
A simple way to see whether price goes up or down 👇
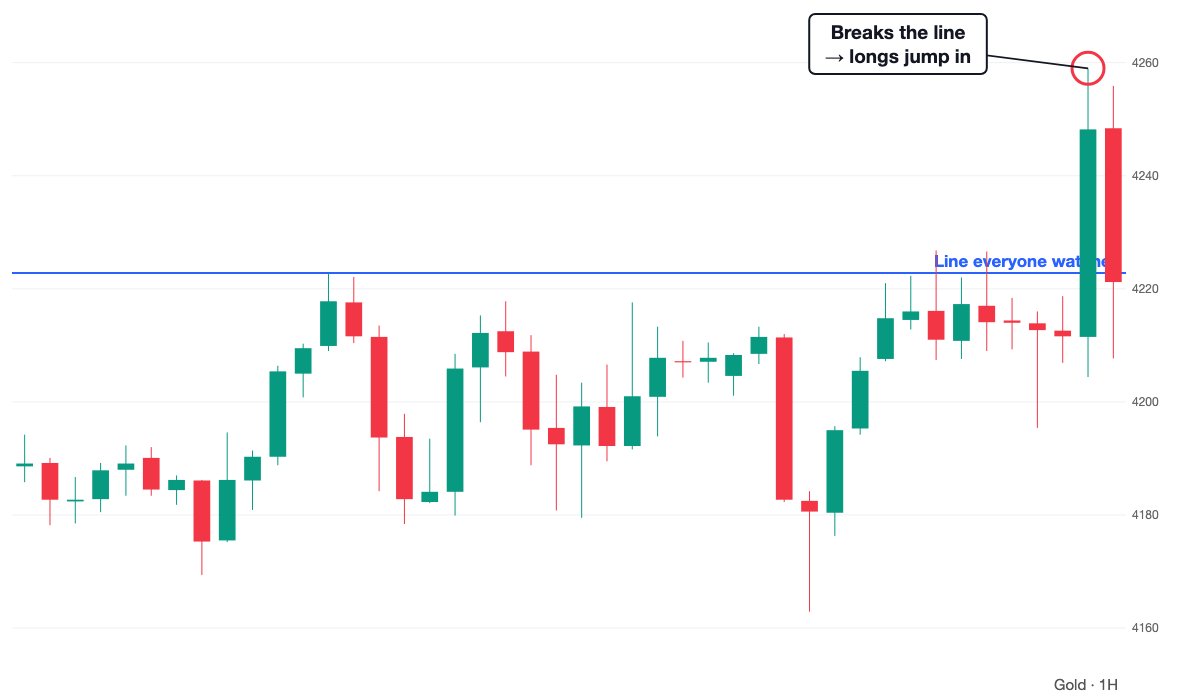
Draw a line where price has bounced again and again.
Breaks it → I look for shorts. Bounces again → I look for longs. $XAUUSD
A method a lot of pro traders use:
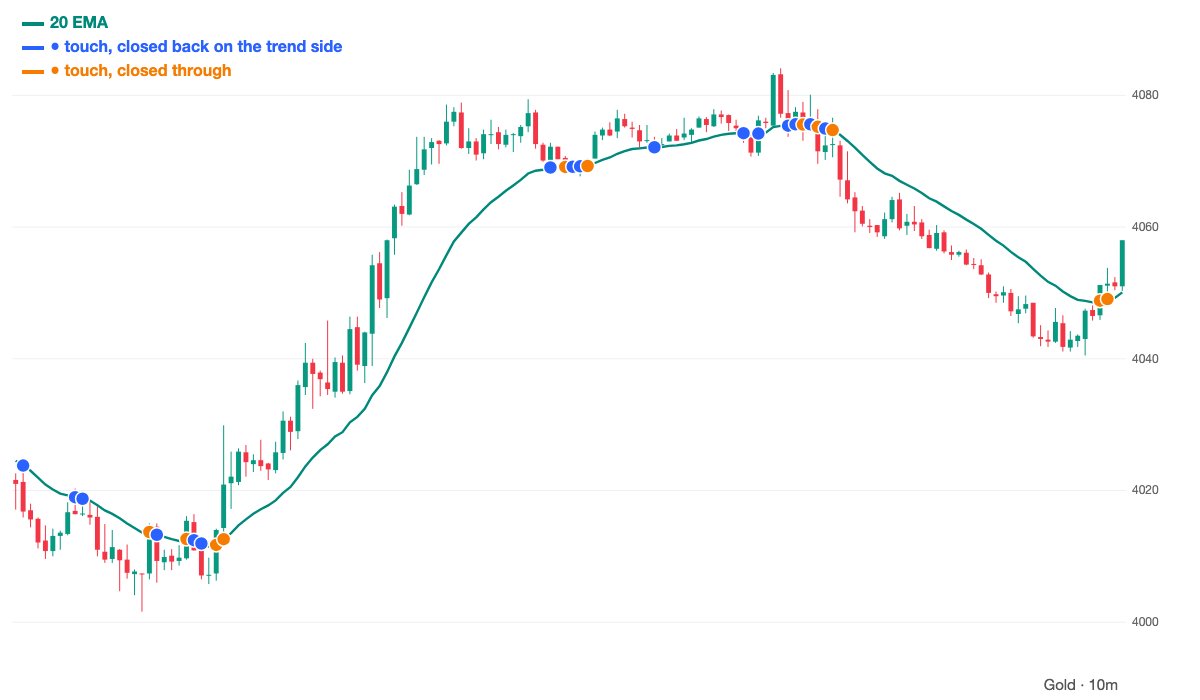
10m chart × 20 EMA.
The 10m sits between the usual timeframes, and it fits the 20 EMA really well.
Try it: put the 20 EMA on the 10m and count how many touches close back on the trend side. $XAUUSD
Nobody teaches this practical stuff.
What to do after a huge spike candle:
where is price in the squeeze/expand cycle, and is the next red candle profit-taking or the start of a downtrend?
Get this wrong and your account drains fast.
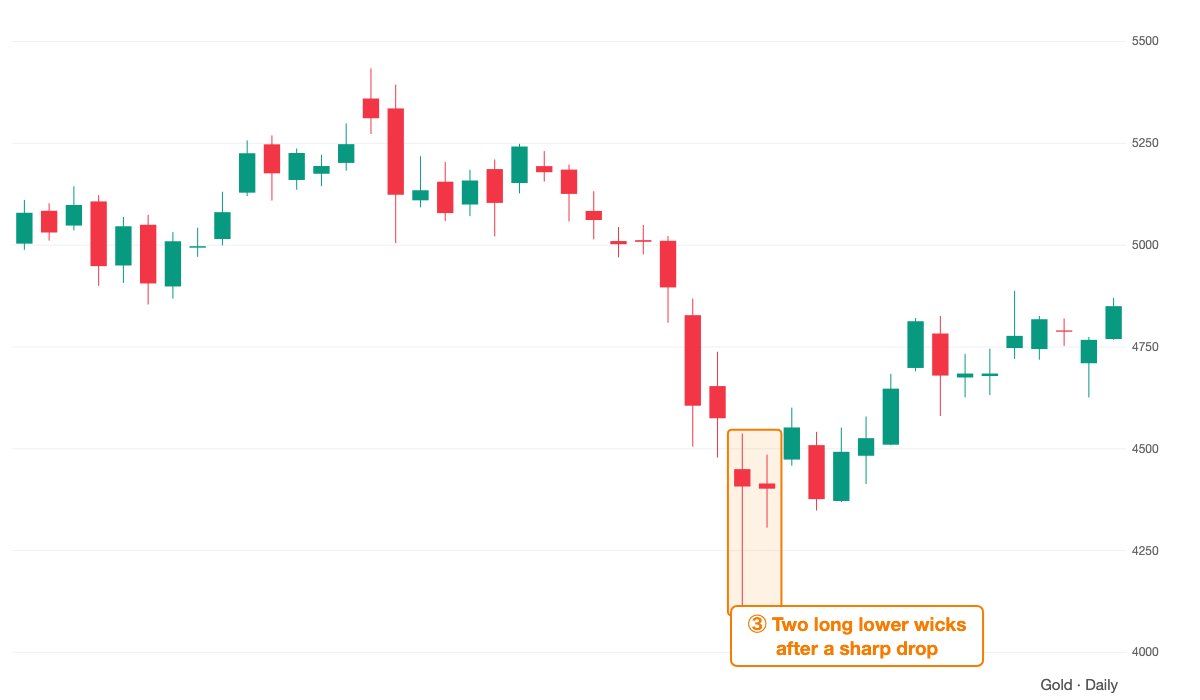
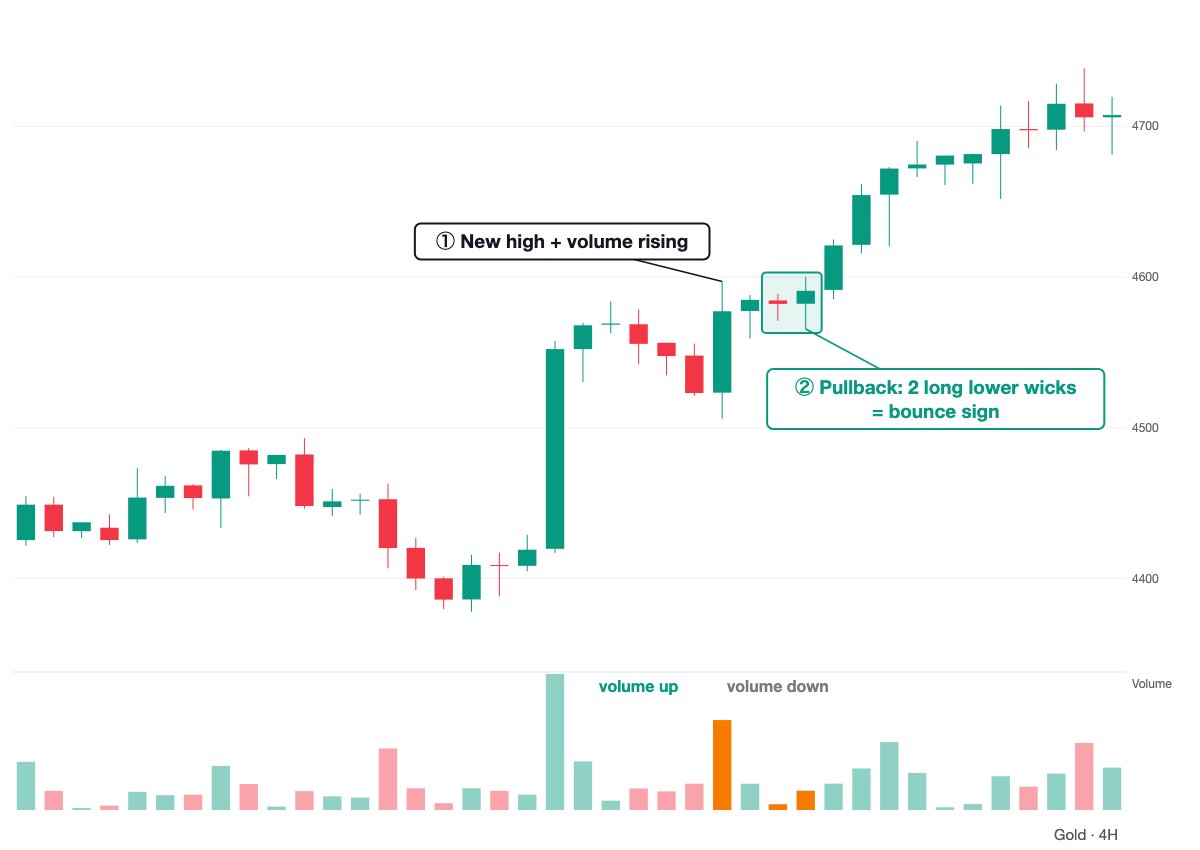
In this chart, volume jumped on the way up and dropped in the pullback. And the pullback printed 2 long lower wicks in a row, a strong bounce sign.
Check these 2 and you'll know if a drop is a pullback or a real decline. $XAUUSD
"Is it too late to buy now?"
People ask this a lot, but it's easy to tell.
When I buy a pullback, I check 2 things:
1. Volume rises as price makes new highs
2. The pullback shows a bounce sign
This shape is really clean.
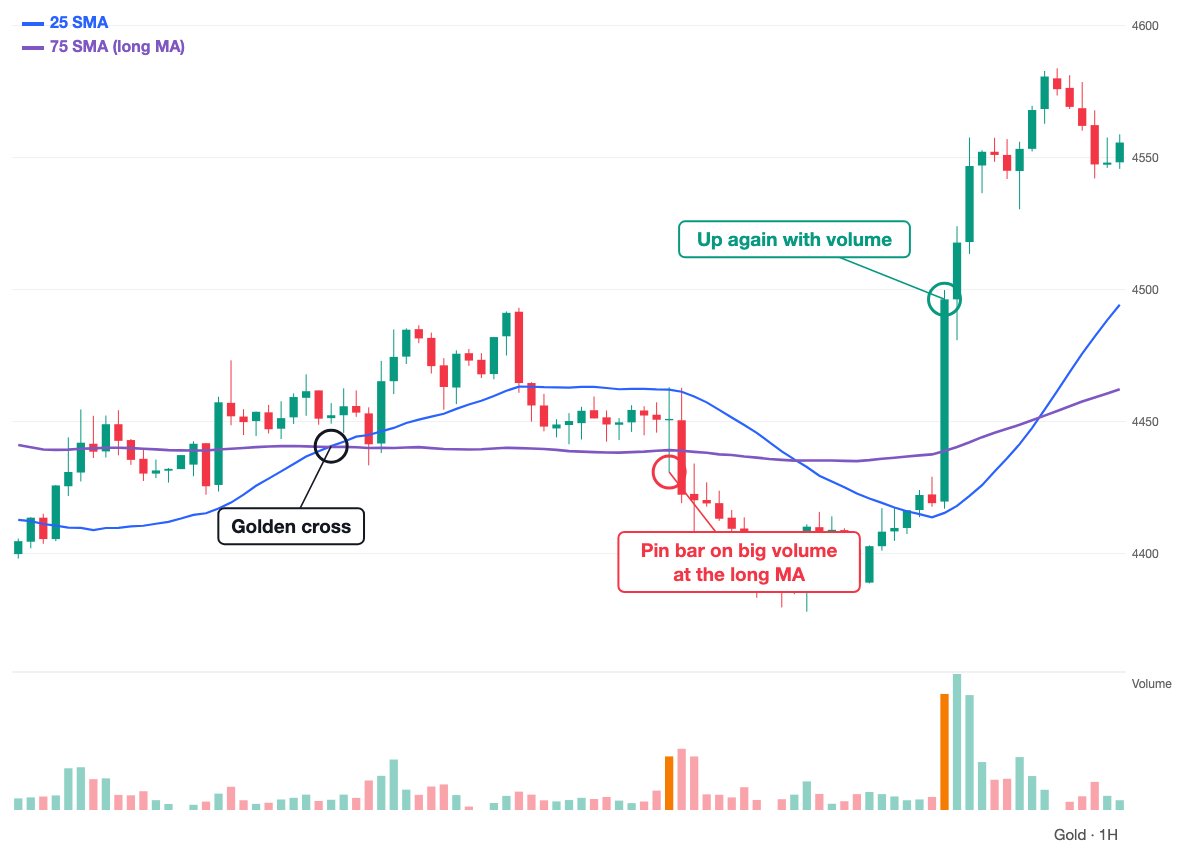
Golden cross, then a pin bar on heavy volume bouncing off the long MA. The long MA is clearly being respected.
Then it tightens and breaks higher with volume. If the next pullback comes on lighter volume, that's the ideal correction.
1→2→3 makes an "N". Volume drops in the pullback, then price jumps on step 3.
So even if you missed the start, the 2→3 moment is a new start.
It's often wave 3, so the move can run.
Remember this if you want to buy low and let profits run. $XAUUSD
"I missed the start of the trend..."
If that's you, you probably don't get the N shape yet.
Price rises in an order. I watch 3 things:
1. New high, by the candle body
2. Pullback to the 5 SMA
3. A body breaks back above the 5 SMA
Profit-taking builds a triangle, but those quiet buyers jump in again on the break, so it speeds up.
When everyone up top is focused on taking profit, spotting the buying underneath matters most.
The goal is to follow the big players as early as you can. $XAUUSD
A move you see a lot after a strong rally:
First a fast run up. Strong, but now everyone is thinking about taking profit.
Then a big red candle at the top. Looks like a reversal, but there's no extra volume on it. Without volume, it's just profit-taking.
After that, nervous traders take profit bit by bit and price tightens.
Look closer: green candles with rising volume keep showing up. Smart money knows the trend isn't over and buys the bounces off the MA.
Another strong pattern:
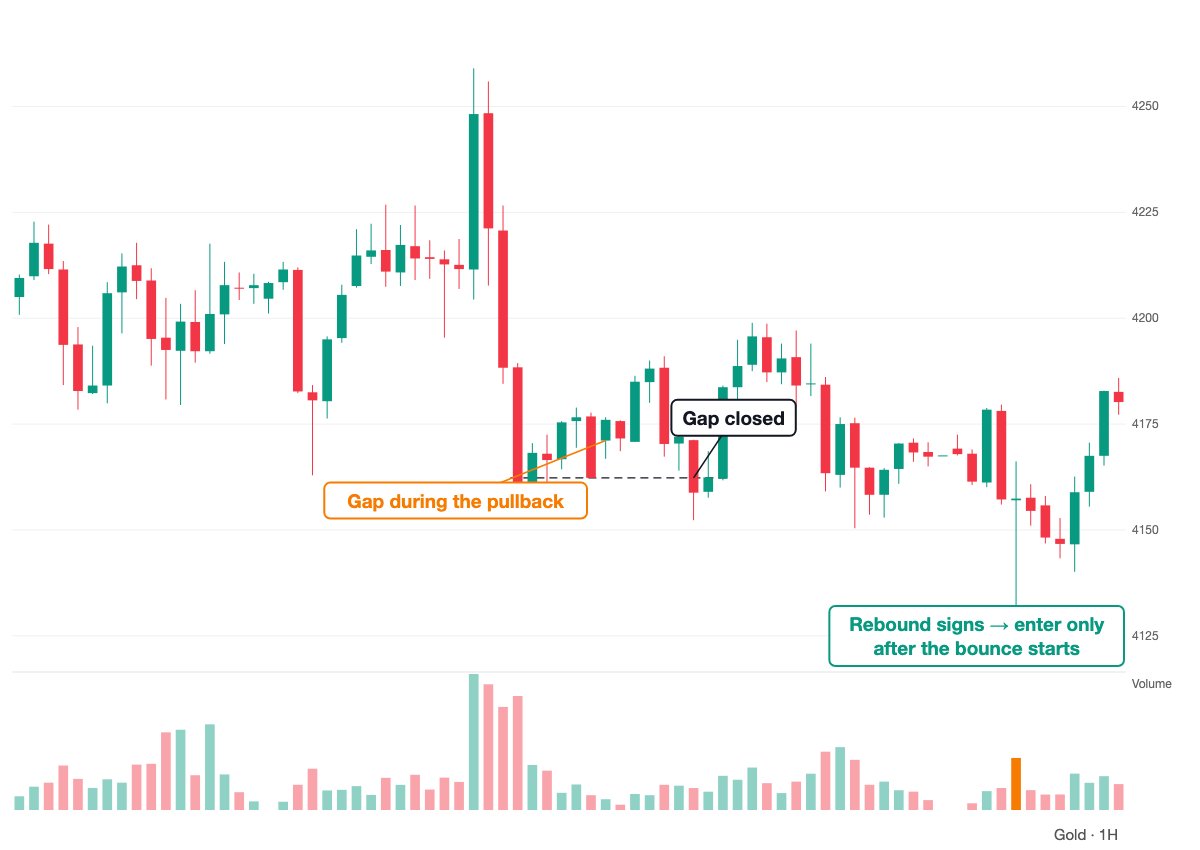
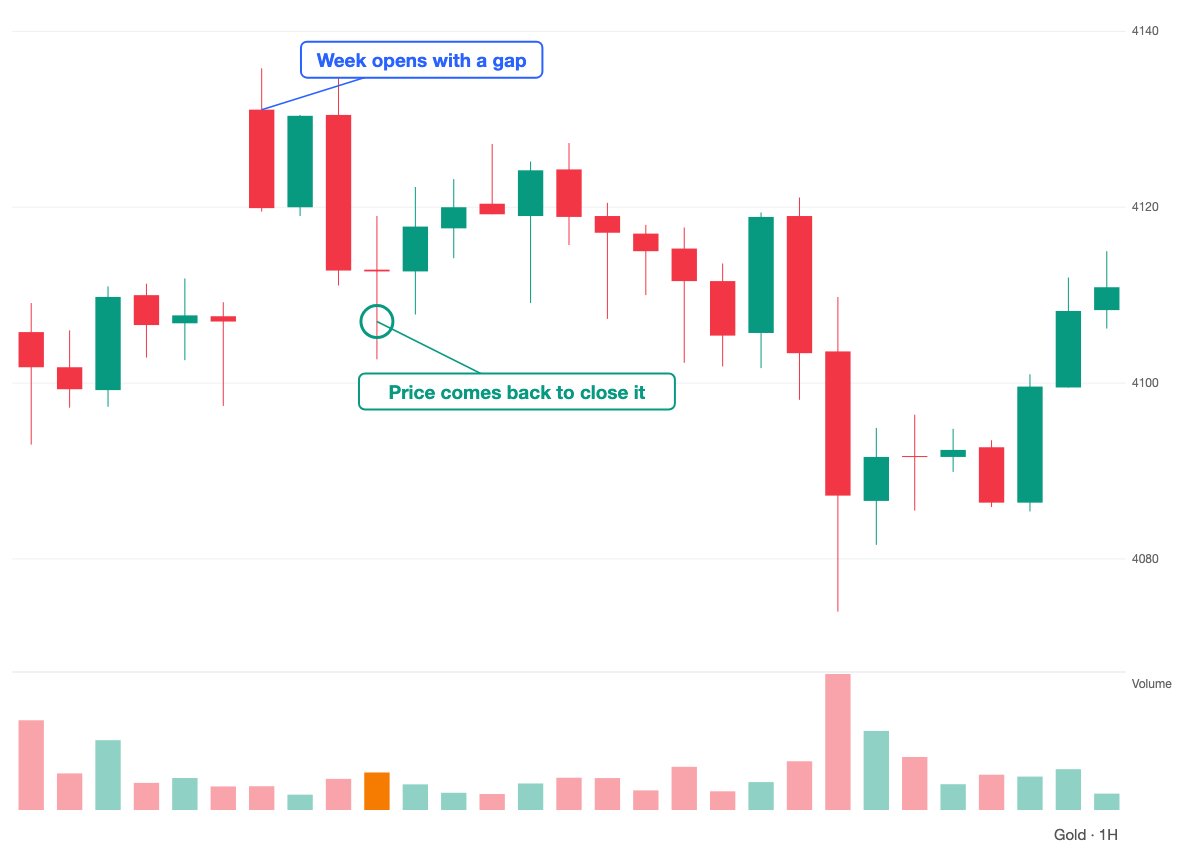
When a big gap opens during a pullback, the pull to close it is stronger than usual.
Once it's closed, rebound signs start to show up.
Careful: if volume is thin, it may not bounce. Wait for the bounce to start before you enter. $XAUUSD
Every spike and every dump moves like this.
If you think you just got unlucky with a fakeout, you'll keep losing.
Price breaks a key level, then snaps back with a big-volume red candle?
I don't buy that break. $XAUUSD
If you don't know when to buy gold, just learn these 4 patterns and trade them.
1. Range breakout candle
2. Opens at the low, closes strong
3. Two long lower wicks after a sharp drop
4. Gap in the trend direction
Fewer pointless trades. Start with 3. $XAUUSD