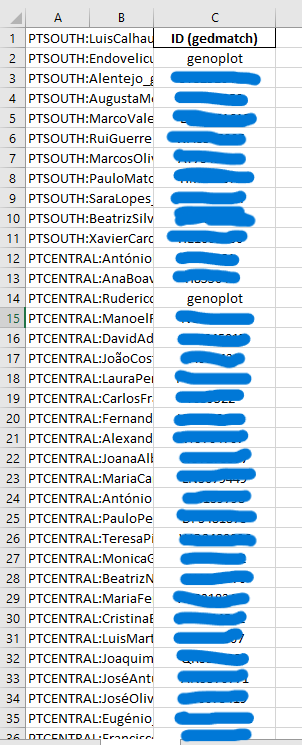
The samples are obviously real, the averages weren't just pulled out of thin air. At best, we can call them sims, but that applies to almost everyone, except for a few who have their real coordinates public, like those two that are easily found on genoplot (Endovelicus and Ruderico). The ged kits (whose IDs I redacted for obvious reasons), along with their names and locations of origin, were noted down.
If anything, at most they "had" them, they don't "have" them anymore. If you download the current G25 dataset, there is no regional distinction whatsoever.
I'm also not sure what exact patterns you're referring to, especially since even in the samples you sent, WHG is exactly 1% higher in the North. The only difference is 1% less IBM in this one, which is completely understandable, whether due to sample size or inherent variation.
Portugal is quite homogeneous, and even within these samples, you have southerners who are closer to northerners and vice versa.
@GeneticaBRZ@ReinholzA Na realidade, é mesmo 0%. Isso só seria mais possível em parte dos madeirenses. Esse artigo é completamente desatualizado e baseado em haplomemes de 2011.
@DCasimiro22821@GeneticaBRZ@toniidorockk@47Tolkien@felippalumbomed Well, the only truly official ones are from the official G25 dataset, and none of them have regional breakdown. The others were created exactly as u described, so they are unofficial. Yet, the results are nearly identical.
@GeneticaBRZ@DCasimiro22821@toniidorockk@47Tolkien@felippalumbomed Yup, most of them were from ged, so they’re simulated via K36, which can cause some distortions. Only a few samples came from people who provided their own official Davidski coords. Either way, it’s definitely worth including Davidski's official one too. https://t.co/PUOxRSzvO4
@47Tolkien Yep, I'm 1/4 Northern Italian, but I imagine it doesn't really shift the profile since they are pretty similar to the Iberians. Thx guy, great work! I recommend it to everyone.
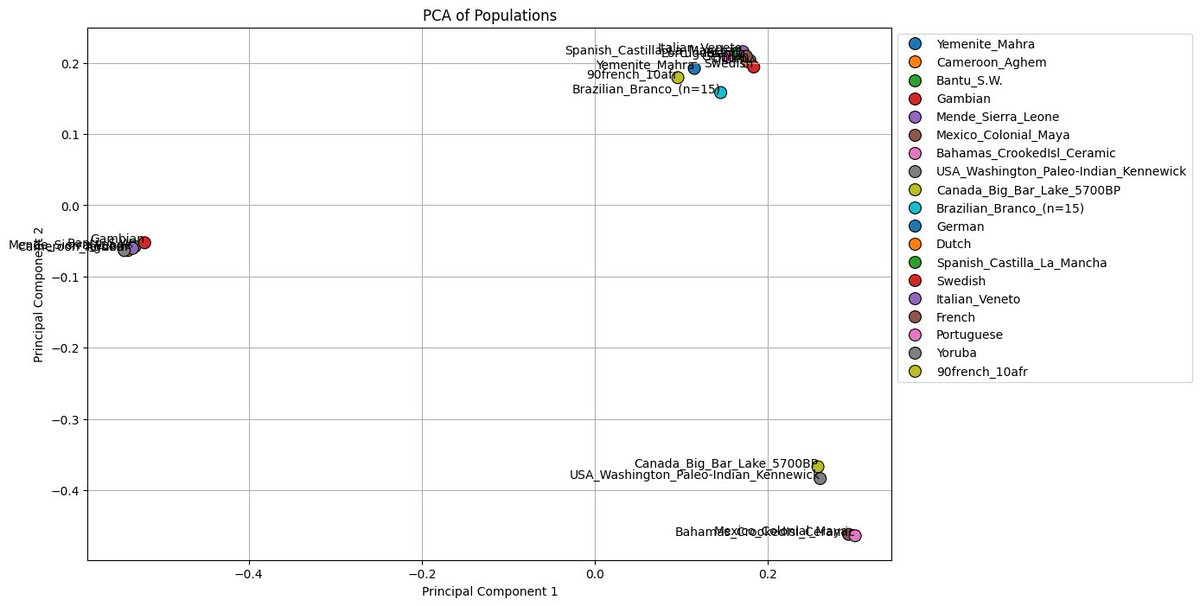
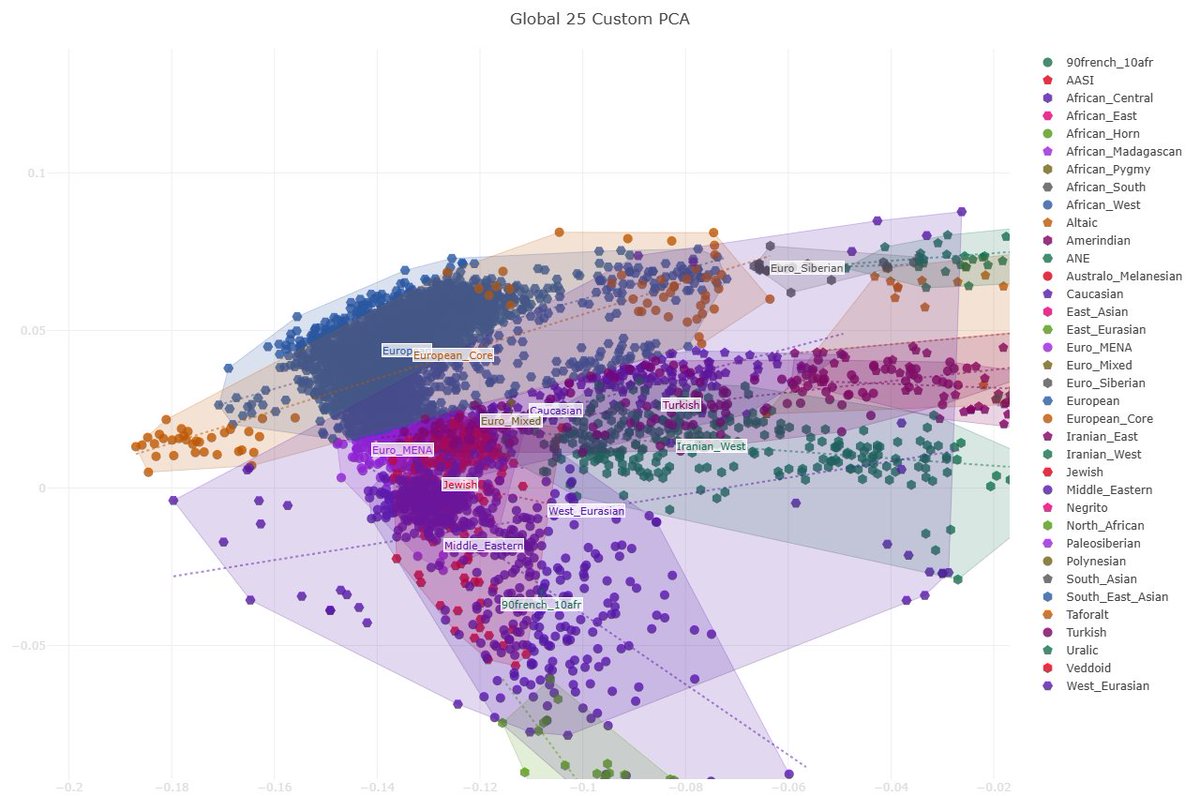
@archoneiros@GeneticaBRZ@Inceltibero_@UmbriciusR Em qual PCA isso não ocorre? O PCA do Global25, utilizando a escala 25, é uma cópia do SmartPCA, uma ferramenta acadêmica. Inclusive posso replicar o mesmo padrão utilizando esta última. Europeus não têm SSA, o shift será sempre evidente, basta inserir os inputs corretos.
@zealfredo848946@DijonLenon@47Tolkien Na verdade, não. Europeus são muito mais próximos entre si do que africanos ou ameríndios. O mapa indica maior percentual europeu no Sul, não necessariamente português. Alguém 90% português e 10% africano é mais distante de um português do que um alemão. Você deve ser novo nisso.
@vctsvr__@47Tolkien Basta comparar os perfis. Não se aproxima do Rio ou MG pois esses possuem um percentual africano bem maior. O percentual de São Paulo (17,4%) é na verdade basicamente igual ao da Paraíba (18,6%), enquanto o do Paraná é de 8%.
https://t.co/9tGjQKcwNr
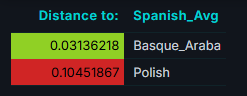
@FrenchAreBrown@nuevomundista@swenstone0@PrinzJosed O FST considera a deriva genética e por isso pode apresentar resultados um pouco cômicos, como os espanhóis aparecendo mais próximos dos eslavos do que dos bascos, por exemplo.
@FrenchAreBrown@nuevomundista@swenstone0@PrinzJosed O G25 tem pontos fracos (ainda que exagerados) em relação ao admixture, mas no que diz respeito às distâncias é um dos melhores que temos, junto ao f2 ou até melhor. Isso já foi discutido e ainda é constantemente, dê uma olhada:
https://t.co/fb8TK4swAs
1. It is the best tool out there (for now), not a perfect tool. I'm aware of its flaws
2. Its not refit every time, its a fixed reference space built on a subset of SNPs from the 1240k set. You can project new samples ONTO it, but its not refitting the PCA each time
3. The Euclidean distances in G25 aren't arbitrary. If you use a truncated set of leading PCs and the truncate error is small the distances approximate the drift based distances that underlie f stats. The reason for their improved accuracy over f-stats is a curiosity (have some understanding of this). qpadm, f-stats, etc are especially fucked, most study models, rank orders, etc are trash or at best mediocre. This wont stop nationalists or 'experts' (unhappy with G25 outcomes or its lack of professional reputation) from claiming its an 'amateur' tool
4. 25 is just a pragmatic cut-off, it retains fine scale clines without letting long tails of tiny variance PCs dominate. With scaled coordinates (which multiply the PCA scores by the root of the eigenvalues) the accuracy increases significantly since it means not every PC is given identical weight
5. G25 is derived from the 1240k dataset as I said. Allelic bias is minimized. Per SNP variance is roughly equalized across the allele frequencwy spectrum
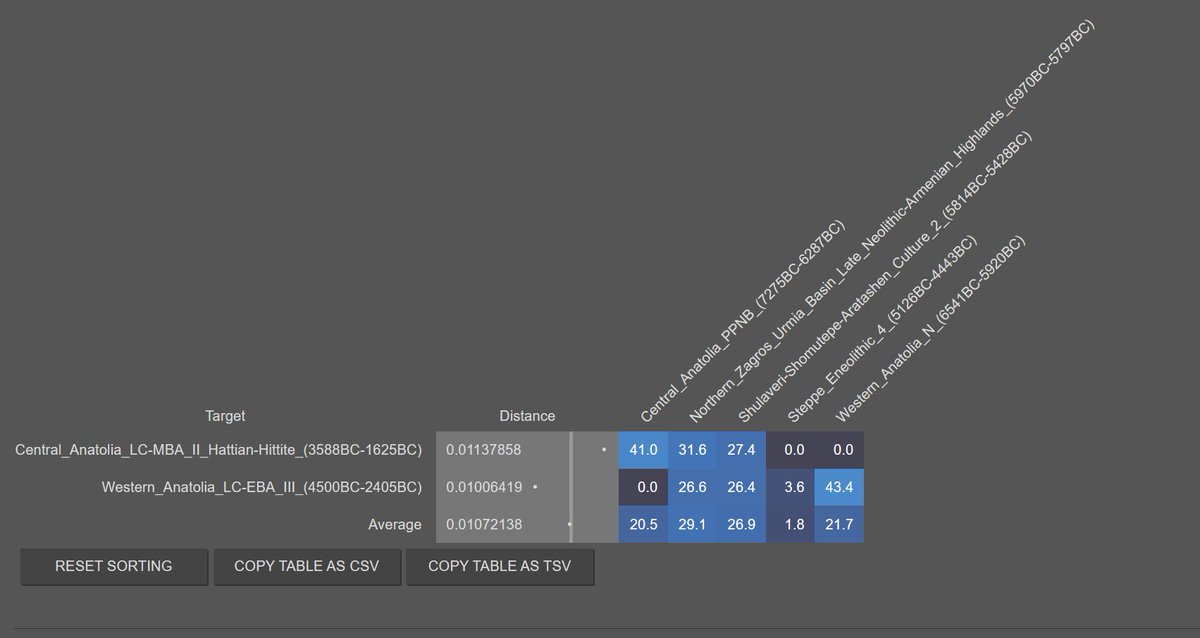
There's not a single tool in the world that can do what I did in the picture below. The specificity and accuracy here is ridiculously powerful. Western Anatolia N only going into Western Anatolians of the LC - BA. Same thing happening with Central Anatolian refs.
Steppe Eneolithic in Western Anatolia and not in Central, western migrations basically confirmed.