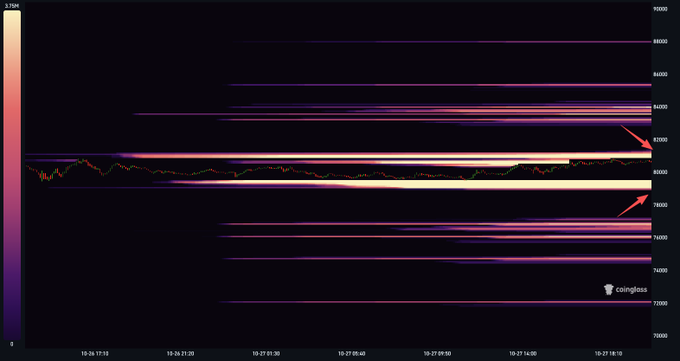
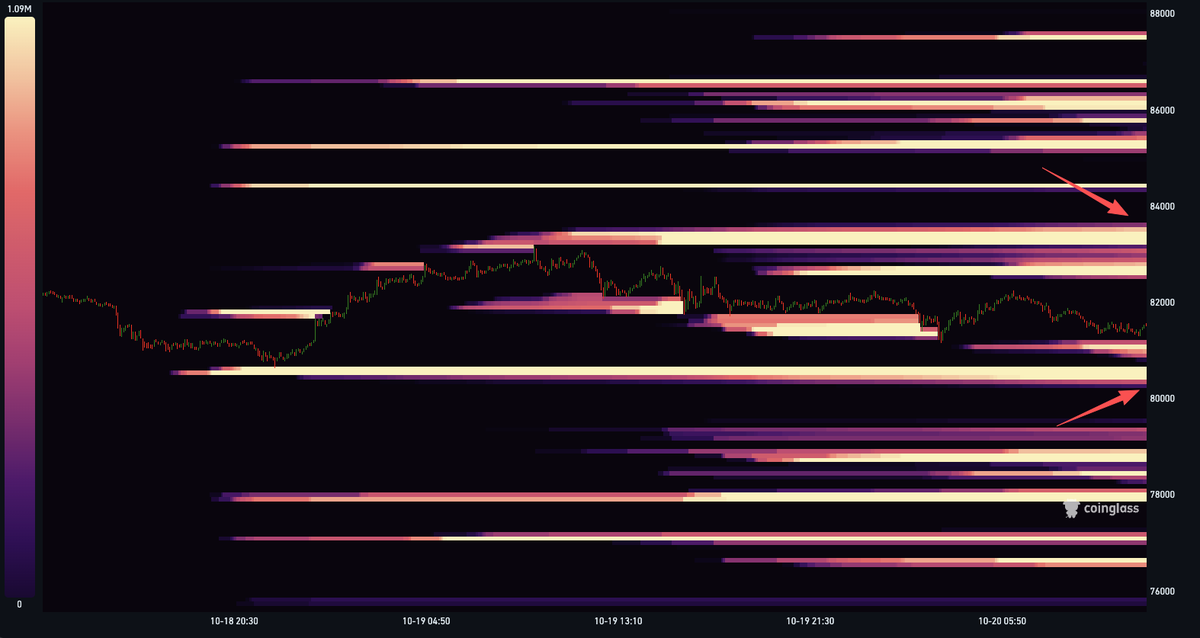
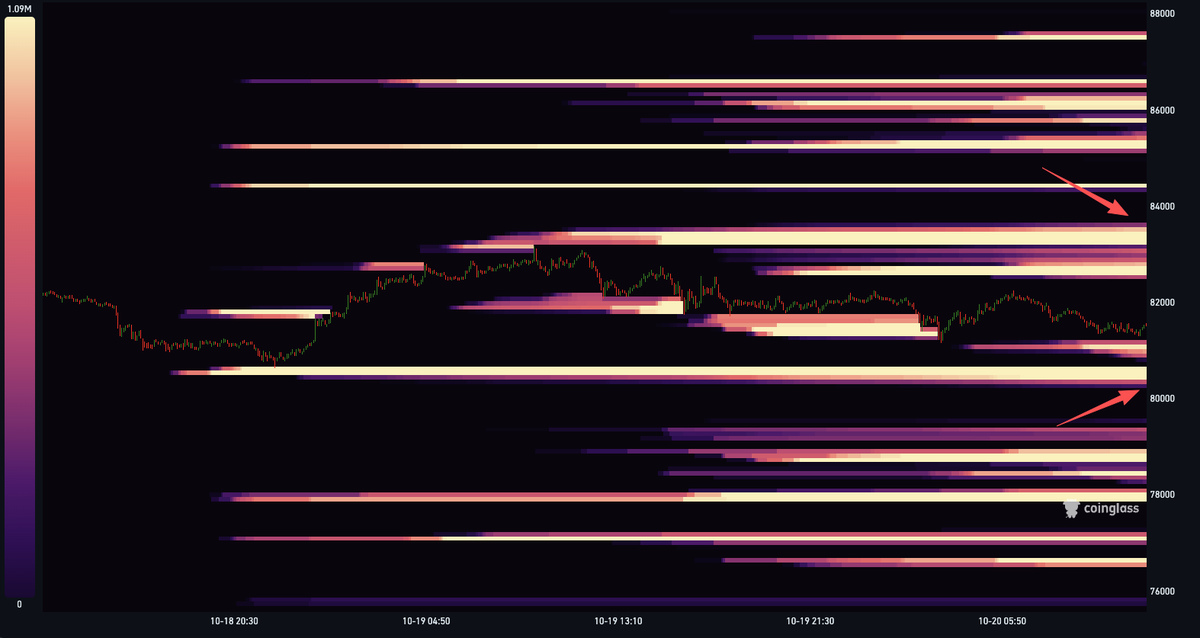
The 48-hour $BTC liquidation heatmap marks high-leverage liquidity at $81K and $79K. Those two clusters sit close enough that a sweep of one band can pull orders through the other.
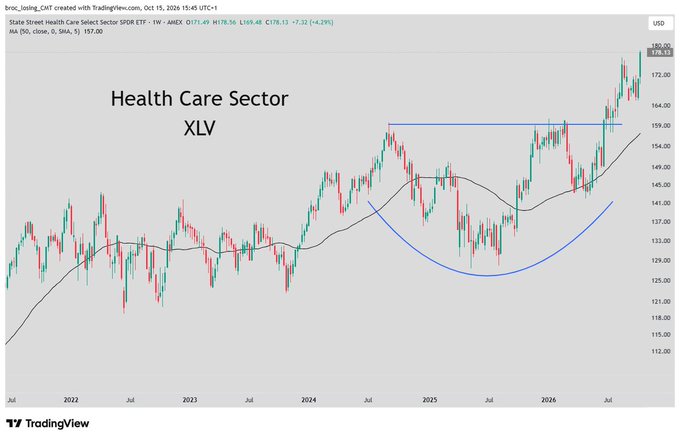
Neoclouds closed at new 52-week lows on Friday, then gapped lower as the week opened after bearish weekend comments from Elon Musk. The tape had already been sounding the alarm well before those remarks.
A trading journal is useful only when it records the reason for the trade.
The rule page can tell you what is allowed; your own log tells you which rule you keep testing in practice.
A gap fill is a statistic, not a trading instruction.
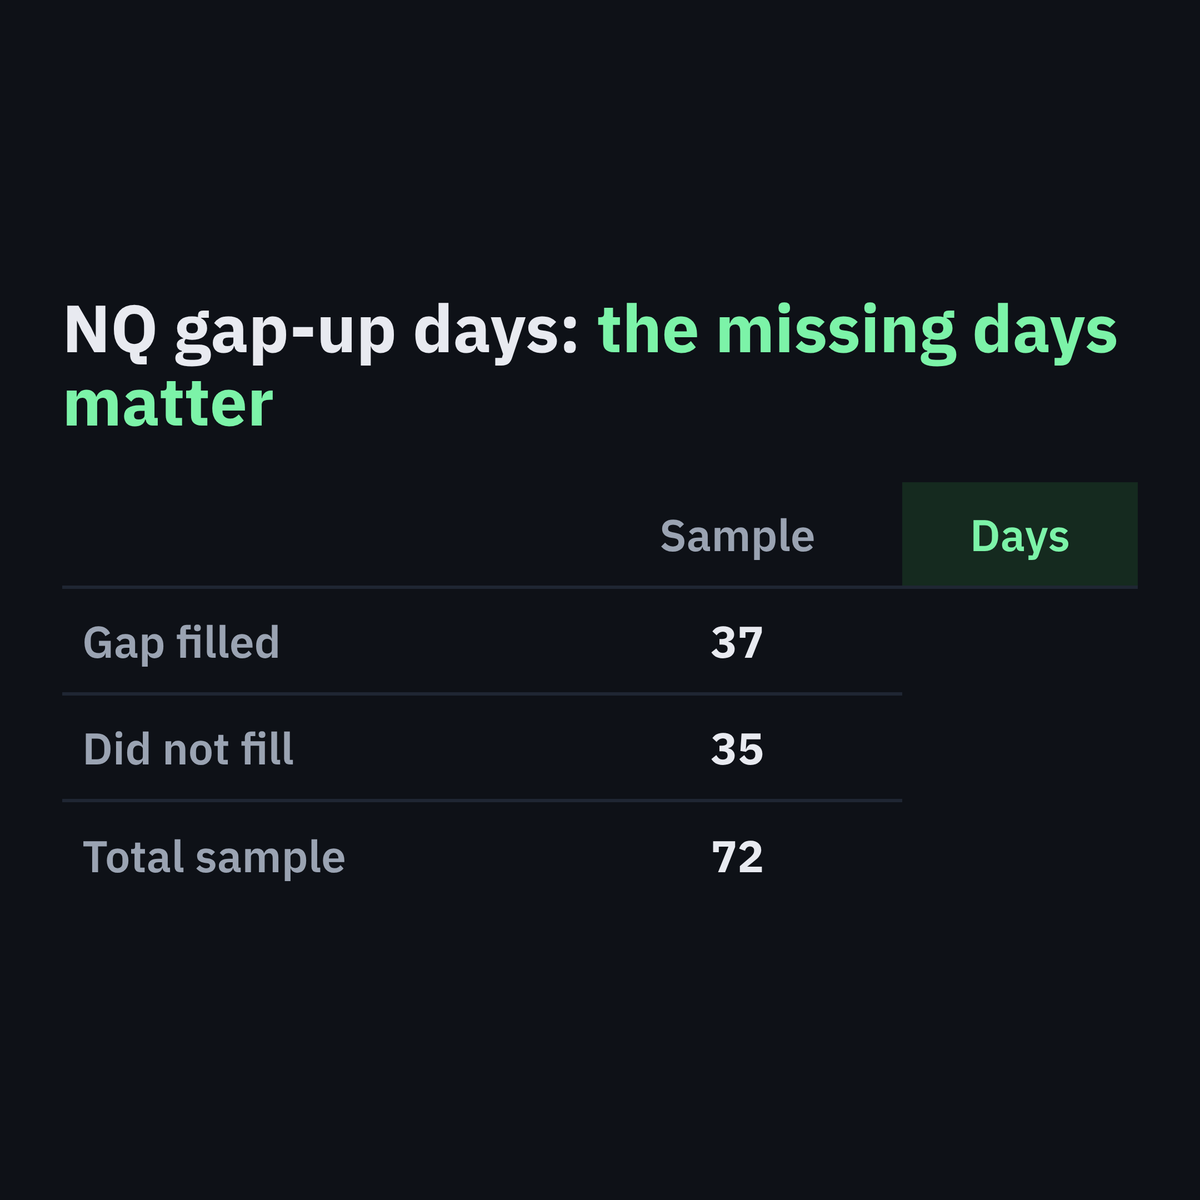
One recent NQ sample counted 37 fills in 72 gap-up days. The missing 35 days are the part a risk plan has to respect.
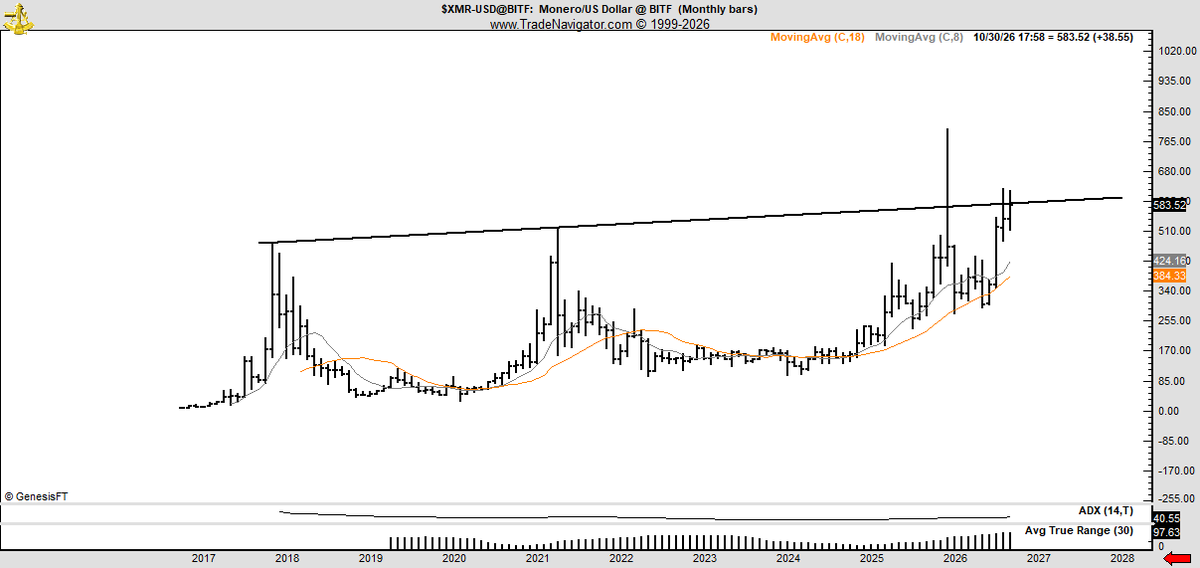
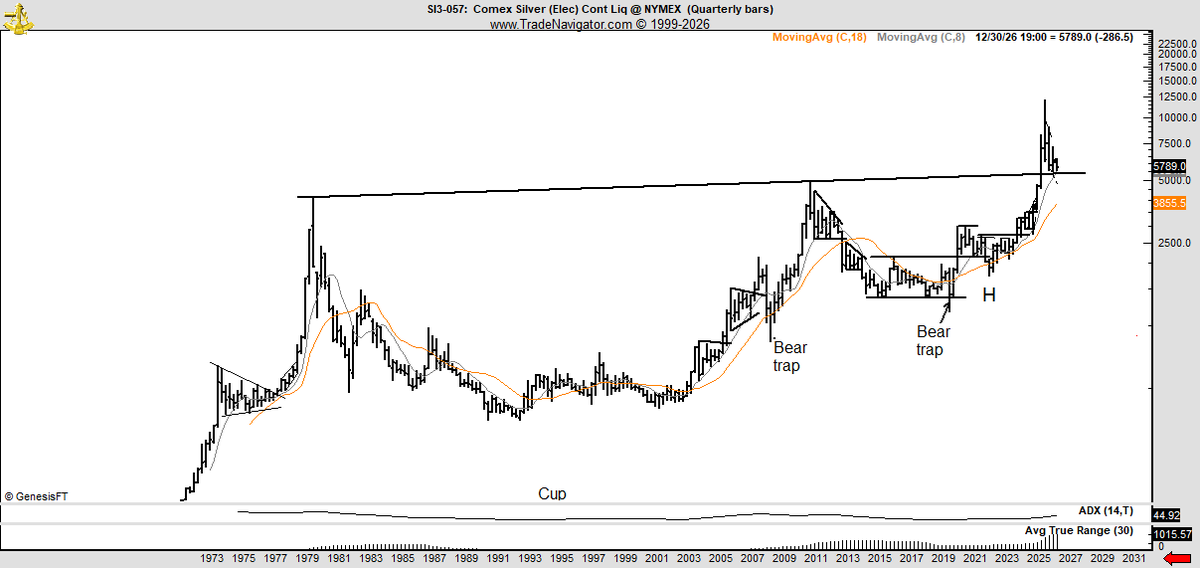
Peter Brandt said Monero’s current pattern looks similar to silver’s before its advance to $125. On the XMR monthly chart, price has repeatedly tested key resistance near 500–600 after a long consolidation, and moving averages have started to strengthen.
The $83.4K and $80.5K magnets on this 48-hour $BTC liquidation heatmap sit where high-leverage positions would be force-closed. The first fills often trigger the rest, so price can run through the band instead of stalling there.
https://t.co/xzDsw1gZni
Fuel oil rose 74.0% over the last year in the September CPI report, and gasoline rose 34.2%, versus 3.7% for overall CPI. Used cars fell 1.5%, the only decline listed.
QCP Group said Bitcoin stayed relatively steady on the anniversary of last October’s largest one-day liquidation. Markets had worried about large U.S. government BTC transfers and a Ledger hack, yet the price still held a range oscillation.
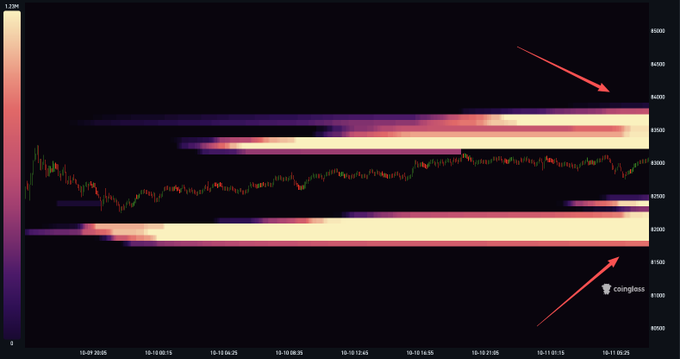
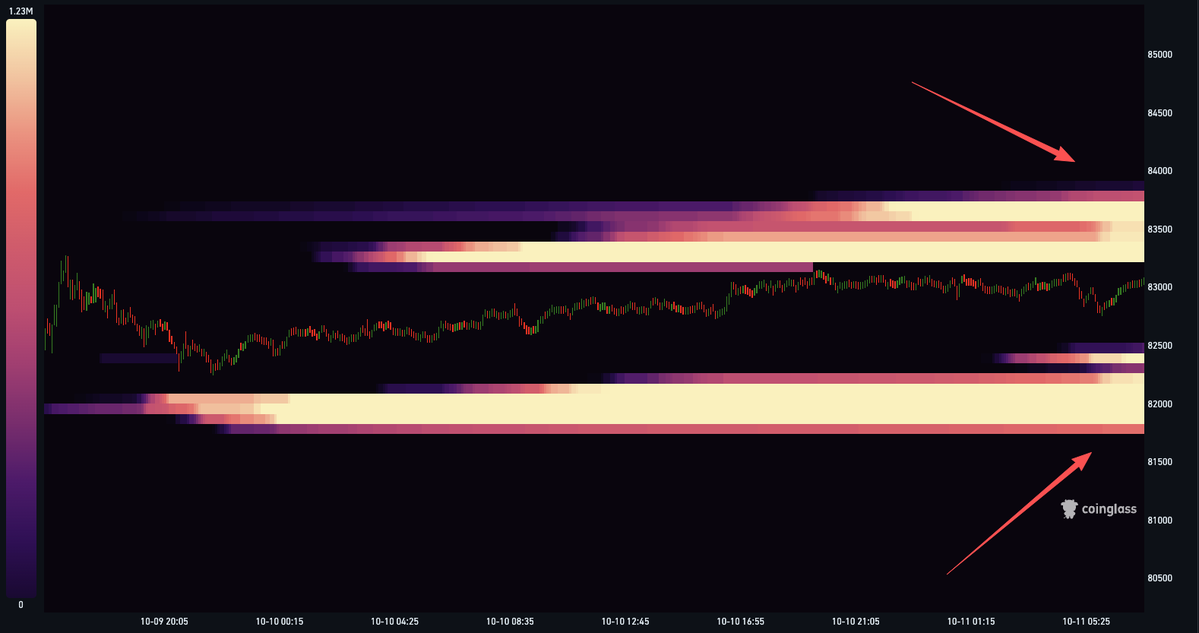
The $83.7K and $81.8K bands on this BTC 48-hour liquidation heatmap are clustered force-close levels for high-leverage books. Tagging them can speed a sweep through those prints. A heatmap does not attract price by itself.
https://t.co/fOSafIhINA
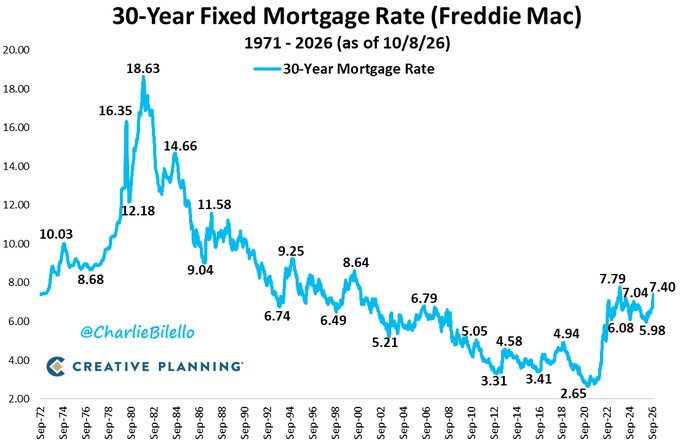
Average 30-year mortgage rate in the US is 7.40%, the highest since Nov. 2023 (Oct. 2023 peak 7.79%, all-time low 2.65% in Jan. 2021). 1970s 8.9%, 1980s 12.7%, 1990s 8.1%, 2000s 6.3%, 2010s 4.1%, 2020s 5.4%. 7.40% is nearer the 2000s than the 2010s.