@NickSchmidt@StockMarketNerd Until his Neuralink chip will be required for implantation at birth. Still like him but don't trust him. I believe there is a very dark side he hides. Just my opinion!
A lot of us obsess about entries and being super precise. Myself included.
But what I’m learning as I go in this trading journey, is that IF that stock is going to be a big winner, buying a 1% past the pivot isn’t going to really matter.
Find a way in, responsibly, and just manage your risk.
I read or listened to EVERY public interview with @DanZanger I could find, spanning 20 years.
Most, I reviewed several times to truly absorb the content, raise and answer more questions, spot more details, and join more dots.
I then condensed my findings into a FREE 6,400-word article.
Not had a chance to read it yet?
Or want to review it again?
You can now also listen to it:
***
The Nuances Behind Dan Zanger
How the story shapes the strategy
🔗 https://t.co/KHW9q2kD33
***
(And yes, that’s me personally reading out the stack. I also play my own piano intro and outro. No AI.)
Risk management is not exciting.
But it's the reason I'm still trading after 20+ years.
Most traders focus on making money.
I focus on protecting capital first.
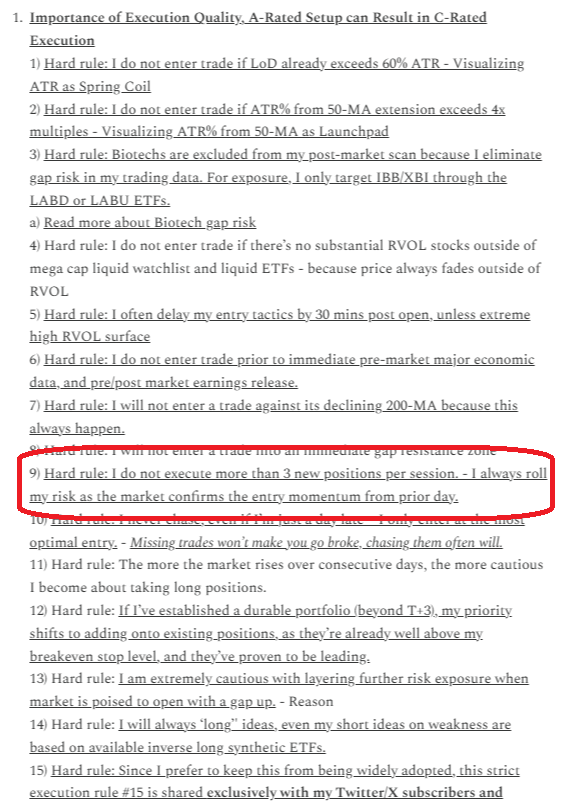
Here are my top 10 risk management rules 👇📈
To find stocks with Elite Relative Strength (RS), you need a systematic scanning process. True market leaders show their strength by making new highs before the major indexes (like the S&P 500 or Nasdaq) or by holding firm when the broader market is correcting.
Here is a step-by-step blueprint to find high-RS stocks using standard scanning tools (like MarketSurge, TradingView, or StockCharts):
1. The Raw Relative Strength Scan (The Baseline)
If you are using a platform that calculates a proprietary RS Rating (like IBD/MarketSurge, which ranks stocks from 1 to 99 based on price performance over the last year), your starting point is simple:
Filter for RS Rating $\ge$ 90: This immediately eliminates 90% of the market, leaving you only with the top 10% of performance.
Filter for RS Rating $\ge$ 95: Use this during a market correction to find the absolute elite tier.
2. Visual RS Scans (The "Line in the Sand")
If you don't have access to 1-99 ratings, you can use the RS Line (which plots the stock's price divided by the S&P 500 index price). Look for these specific visual behaviors:
RS New High Before Price
This is one of the most powerful leading indicators in technical analysis.
The Setup: The stock price is still consolidating or pulling back below its recent peak, but the RS Line has already broken out to a clear new lifetime or 52-week high.
What it means: Institutional accumulation is silently aggressive. Big money is absorbing every share available while the general market is distracted.
Blue Dot Scans (MarketSurge / Custom Scripts)
A "Blue Dot" occurs when a stock's RS line hits a new 52-week high while the stock itself is still in a base or consolidation pattern.
If you use TradingView or ThinkOrSwim, you can search for community scripts called "RS Line New High Before Price" or "IBD RS Blue Dot" to plot this automatically on your charts.
3. Market Correction Scans (The "Resilience" Test)
The absolute best time to find true RS is when the market index ($SPY or $QQQ) is actively falling. When the tide goes out, you see who is swimming with a rocket booster.
Run a scan with these parameters during a market pullback:
Price: Stock is trading above its rising 8-week EMA (or 21-day EMA).
Index Comparison: The S&P 500 is trading below its 21-day or 50-day moving average.
Performance: Stock is within 10% of its 52-week highs, while the index is down 5% to 10%+ from its highs.
4. Combining RS with Volume Signatures
High RS on low volume can be a trap. To ensure the relative strength is backed by institutional footprint, layer your RS scans with volume filters:
RS > 90 + HV1 (Highest Volume in 1 Year) within the last 5-10 days.
RS > 90 + HVE (Highest Volume Ever) on a recent PEG (Power Earnings Gap).
A Quick Example Checklist:
If the market sells off 300 points, look for the stock that finishes the day positive or completely flat on above-average volume. Put that ticker at the top of your watchlist it is your primary candidate for an Inside Day contraction or an Under-Cut and Rally (U/C) setup the moment the market stabilizes.
When I just started trading, I kept hearing all these big-name traders banging the table about studying — charts, journal, etc.
I wanted to do what they said.
Only one problem:
Nobody was clear about HOW to study.
Now, I appreciate that different things work for different people.
But I didn’t realise this at the time. I was looking for tangible instructions, not vague advice like “review your trades”.
Tangibility exists though.
For journal analysis, @Trader_Dante made many practical suggestions in his videos, most notably the MAE: https://t.co/gDOUyNFBvx
To do a deep dive into the charts, you can derive a practical step by step from @PradeepBonde’s work: https://t.co/0ehoSPgH6L
More recently, I’d been working with top USIC performers, digging into how they study.
This is where the ‘formula’ started becoming clear:
Deep study = intentionality + a routine that works for YOU + lots of focused reps.
Intentionality truly is key — but the intensity required is only sustainable when you also enjoy what you’re doing.
How well you can alchemise the discomfort associated with intentional studying into fulfilment — if not outright have fun — determines your long-term success with the method.
Which is where personalisation is so important.
If you need some ideas as a starting point…
https://t.co/MM09EMgVuf
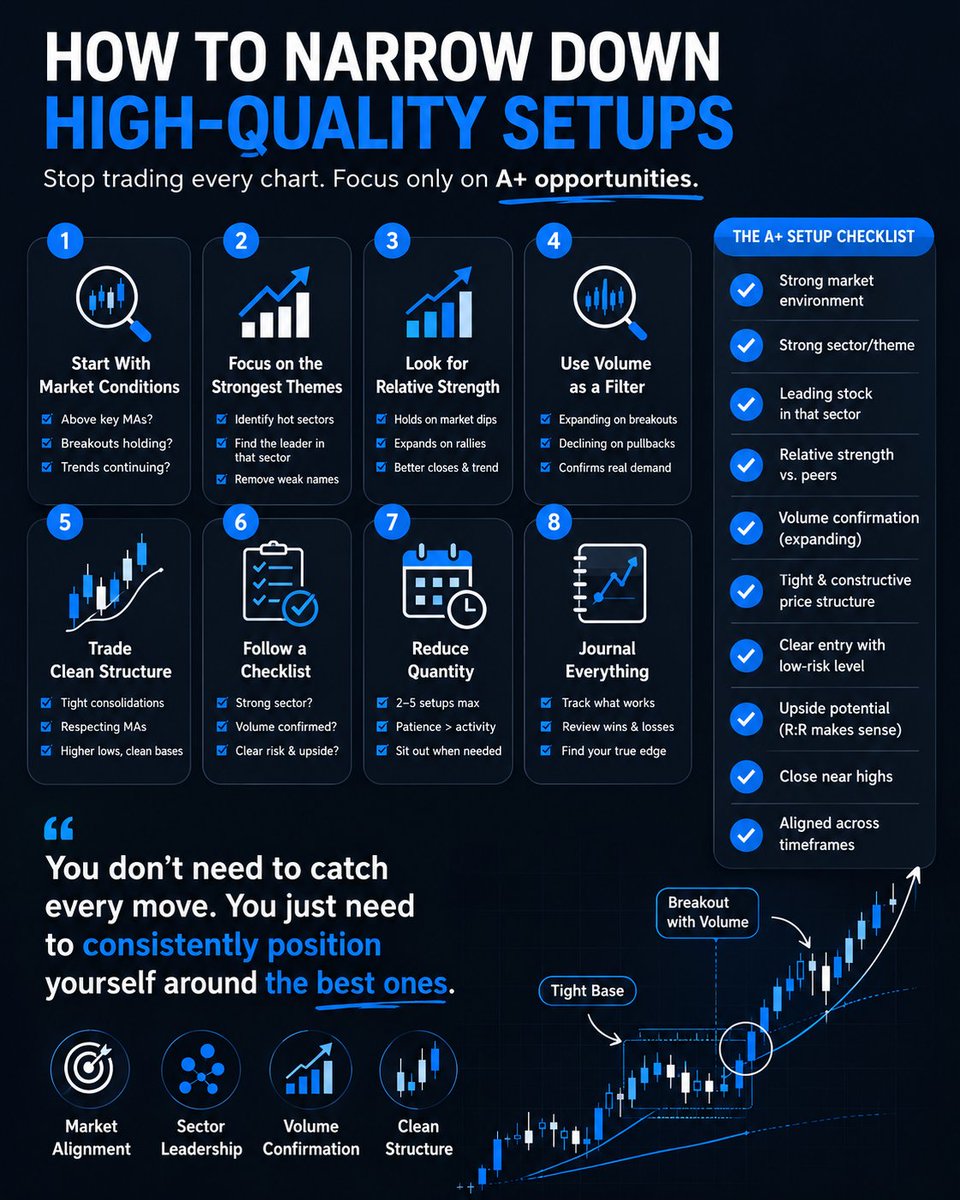
One of the biggest mistakes traders make is trying to trade every setup they see.
The goal is not to find MORE trades.
The goal is to find the BEST trades.
Most traders don’t lose because they lack good entries... they lose because they lack filters.
Here’s how I personally narrow down setups and focus only on A+ opportunities:
1. Start with market conditions
Before I even look at individual stocks, I want to know what type of market we’re in.
-Are breakouts working?
-Are stocks holding gains?
-Is there trend continuation?
-Are we above key moving averages?
If the market is choppy, I already know I need to:
-Reduce size
-Reduce trades
-Be more selective
Or sit in cash
2. Focus on the strongest themes
Money moves in sectors and themes.
AI.
Semis.
Robotics.
Space.
Instead of scanning random charts, I want to identify:
The strongest sector
Then the strongest stock inside that sector (The liquid leaders)
3. Look for relative strength
The best setups show strength BEFORE they break out.
Examples:
Market pulls back → stock barely pulls back
Market chops → stock tightens up
Market rallies → stock expands aggressively
Those are leaders.
If two charts look similar, I’ll always choose:
-Better relative strength
-Better closes
-More tigthness
-Better volume patterns
4. Volume is non-negotiable
Volume tells you whether institutions are involved.
I always ask:
“Is money actually pouring into this stock?”
If the answer is no, I usually skip it.
You want to see volume decreasing on a pullback and increasing on a break of range
5. Trade clean structure
The best setups are usually simple.
I want charts that are:
-Tight
-Constructive
Respecting moving averages
-Consolidating cleanly
-Building higher lows
-Closing near highs
I avoid:
-Loose action
-Huge wicks
-Choppy ranges
-Overextended names
Clean structure = easier risk management.
6. Reduce quantity
You do NOT need:
-100 watchlist names
-50 open positions
-Constant action
Some of the best trading weeks come from:
-4-5 great setups
-Proper sizing
-Patience
At the end of the day, narrowing down setups is really about alignment.
-Market
-Sector
-Leadership
-Volume
-Structure
When all of those align together, that’s when high probability setups appear.
You don’t need to catch every move.
You just need to consistently position yourself around the best ones.