What’s up with the recent downturn in home runs, and has the ball changed for the 2nd time this season?
The Ballpark Pal model tracks a bunch of things so it can react to these sorts of changes. Here’s an overview of what the data is showing (not AI, tldr at the end)
Context
It isn’t a secret that the baseball MLB uses changes frequently - between years and during the season. This year’s ball started the year performing very similar to 2025 until late-May when it began carrying farther (after adjusting for weather).
From that point up until the All-Star Break there were around 2.6 HRs per game. After the ASB there have been 2.2 HRs per game and just 1.8 over the last 7 days. To complicate things, July 20th had the MOST homers (53) in a single day since 2022.
Home run totals are relatively small, which makes things noisy day-to-day. They will fluctuate over the course of the season, usually for no good reason at all other than regular variance. So the problem is figuring out whether the change is random or due to something real. Fortunately there a number of metrics that Ballpark Pal uses to help determine this. Here’s what they’re showing now:
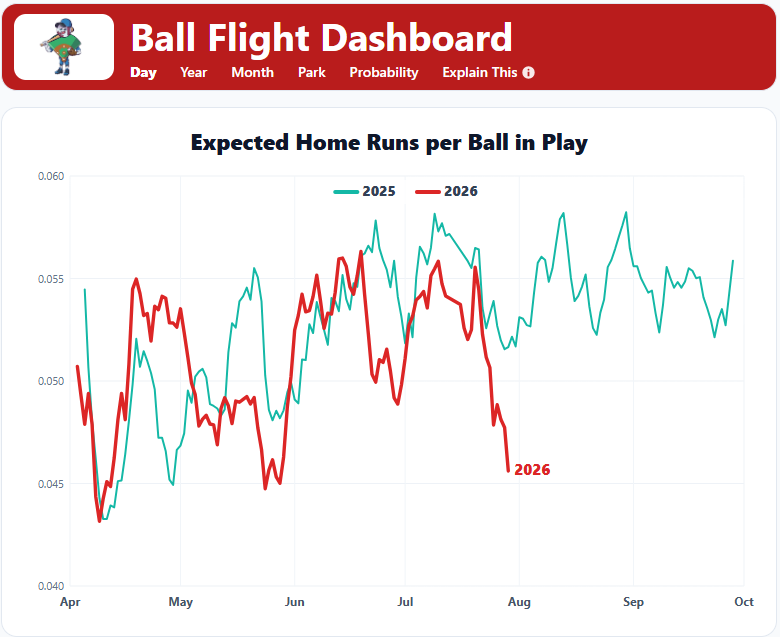
Expected Home Runs per Ball In Play
Poor contact quality is the biggest factor in the post-ASB downturn. Hitters simply haven’t been putting nearly as many quality fly balls in the air. After hovering around .054 exp HRs per batted ball since June, that number has fallen to .046 over the past 10 days (a 15% reduction).
Could this be due to a ball change? Maybe… but the changes we’ve seen over the years have affected how far the ball *travels* - not how it leaves the bat. While the .046 is very low, it isn’t unheard of for a 10-day trend. Regardless, the reduction in contact quality is exacerbating whatever else may be going on with the baseball.
Total Distance vs Expected
Fly ball distance clearly ticked up after the apparent ball change in late May. While it’s come down *slightly* after the ASB, it hasn’t returned to its April/May level.
This is the best indicator of the ball NOT having changed – although another week of data at the current level may suggest some in-between version of the old and new balls.
Home Runs vs Expected
The 7-day trend here is the best evidence of a ball change. The new -15% level is 10-20% lower than the previous eight weeks and falls right in line with April and most of May before the first change occurred.
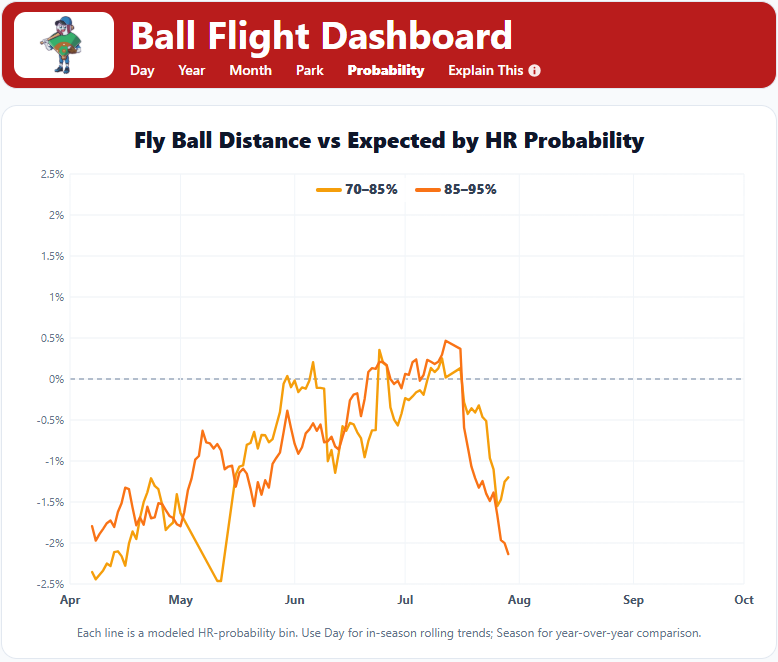
Distance vs Expected for Marginal Fly Balls
So how can home runs be lower than expected while total distance is holding steady? Here’s an example. Let’s say a new ball is introduced that reduces carry distance AFTER the ball travels 350 feet. In that case, very few fly balls would be affected, but it would certainly reduce the home run rate.
This may feel like a bit of a stretch but is what’s showing in the recent data. Fly Ball Distance vs Expected for marginal home run balls (70-95% HR Chance) has dropped by 2% over the last 14 days. That’s actually a pretty big change and is right in line with the March/April/May level this season.
If there was in fact a ball change after the ASB, this would be the smoking gun. The problem is that this trend is noisy and takes a while to stabilize. It could be a random fluctuation that reverts back upward next week.
Is the Ballpark Pal model reacting?
Yes, home run probabilities in the game sims have been coming down in reaction to the recent trends. Like with any short-term change, it’s a gradual adjustment to leave open the possibility that things will revert to normal levels. If you look at today’s home run projections, only 9 hitters are given better than +400 odds to homer, and the 2.34 per game projection is quite low for late July.
TL;DR
The biggest factor in the recent HR drought is contact quality – hitters not producing enough homer-worthy fly balls off the bat. But home runs are also now running about 15% below expected - the strongest evidence that the ball may be carrying less, particularly on marginal home run balls.
That could indicate a second ball change, though the sample remains too noisy to say confidently. As always, the Ballpark Pal model is reacting to the possible change, although gradually as the trend develops.
🚨 NEAR HOME RUN! 🚨
George Springer (Toronto Blue Jays)
vs Bryan King (Houston Astros)
💨 96.1 mph
📐 26.0°
📏 339.0 ft
📍 Bot 8 inning
🏟️ Rogers Centre
Would be a HR in 2/30 ballparks! Result: Double Play
FINALLY LOGAN
O’HOPPE HOMER ✅
HOSKINS HOMER ✅
ARANDA HOMER ✅
ABRAMS HOMER ✅
RICE HOMER ✅
The Law Always Wins.
Inner Circle Discord Waitlist is open . Link in bio 🔴